Little Excitement Around Guangdong Quanwei Technology Co.,Ltd.'s (SZSE:300716) Revenues As Shares Take 28% Pounding


Unfortunately for some shareholders, the Guangdong Quanwei Technology Co.,Ltd. (SZSE:300716) share price has dived 28% in the last thirty days, prolonging recent pain. For any long-term shareholders, the last month ends a year to forget by locking in a 58% share price decline.
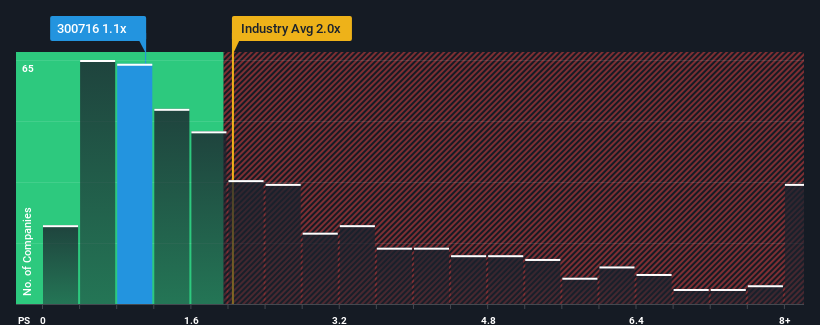
Following the heavy fall in price, Guangdong Quanwei TechnologyLtd may be sending buy signals at present with its price-to-sales (or "P/S") ratio of 1.1x, considering almost half of all companies in the Chemicals industry in China have P/S ratios greater than 2x and even P/S higher than 5x aren't out of the ordinary. Nonetheless, we'd need to dig a little deeper to determine if there is a rational basis for the reduced P/S.
See our latest analysis for Guangdong Quanwei TechnologyLtd
How Guangdong Quanwei TechnologyLtd Has Been Performing
For example, consider that Guangdong Quanwei TechnologyLtd's financial performance has been poor lately as its revenue has been in decline. One possibility is that the P/S is low because investors think the company won't do enough to avoid underperforming the broader industry in the near future. Those who are bullish on Guangdong Quanwei TechnologyLtd will be hoping that this isn't the case so that they can pick up the stock at a lower valuation.
Although there are no analyst estimates available for Guangdong Quanwei TechnologyLtd, take a look at this free data-rich visualisation to see how the company stacks up on earnings, revenue and cash flow.What Are Revenue Growth Metrics Telling Us About The Low P/S?
In order to justify its P/S ratio, Guangdong Quanwei TechnologyLtd would need to produce sluggish growth that's trailing the industry.
Retrospectively, the last year delivered a frustrating 32% decrease to the company's top line. As a result, revenue from three years ago have also fallen 59% overall. Therefore, it's fair to say the revenue growth recently has been undesirable for the company.
Weighing that medium-term revenue trajectory against the broader industry's one-year forecast for expansion of 23% shows it's an unpleasant look.
With this information, we are not surprised that Guangdong Quanwei TechnologyLtd is trading at a P/S lower than the industry. Nonetheless, there's no guarantee the P/S has reached a floor yet with revenue going in reverse. There's potential for the P/S to fall to even lower levels if the company doesn't improve its top-line growth.
What We Can Learn From Guangdong Quanwei TechnologyLtd's P/S?
Guangdong Quanwei TechnologyLtd's recently weak share price has pulled its P/S back below other Chemicals companies. Using the price-to-sales ratio alone to determine if you should sell your stock isn't sensible, however it can be a practical guide to the company's future prospects.
Our examination of Guangdong Quanwei TechnologyLtd confirms that the company's shrinking revenue over the past medium-term is a key factor in its low price-to-sales ratio, given the industry is projected to grow. Right now shareholders are accepting the low P/S as they concede future revenue probably won't provide any pleasant surprises either. Given the current circumstances, it seems unlikely that the share price will experience any significant movement in either direction in the near future if recent medium-term revenue trends persist.
There are also other vital risk factors to consider before investing and we've discovered 3 warning signs for Guangdong Quanwei TechnologyLtd that you should be aware of.
Of course, profitable companies with a history of great earnings growth are generally safer bets. So you may wish to see this free collection of other companies that have reasonable P/E ratios and have grown earnings strongly.
New: Manage All Your Stock Portfolios in One Place
We've created the ultimate portfolio companion for stock investors, and it's free.
• Connect an unlimited number of Portfolios and see your total in one currency
• Be alerted to new Warning Signs or Risks via email or mobile
• Track the Fair Value of your stocks
Have feedback on this article? Concerned about the content? Get in touch with us directly. Alternatively, email editorial-team (at) simplywallst.com.
This article by Simply Wall St is general in nature. We provide commentary based on historical data and analyst forecasts only using an unbiased methodology and our articles are not intended to be financial advice. It does not constitute a recommendation to buy or sell any stock, and does not take account of your objectives, or your financial situation. We aim to bring you long-term focused analysis driven by fundamental data. Note that our analysis may not factor in the latest price-sensitive company announcements or qualitative material. Simply Wall St has no position in any stocks mentioned.
About SZSE:300716
Guangdong Quanwei TechnologyLtd
Researches, develops, produces, sells, and services polymer materials and products in the People’s Republic of China and internationally.
Low and overvalued.
Market Insights

Community Narratives

