
Advertisement
A Look At The Fair Value Of Guangzhou Tinci Materials Technology Co., Ltd. (SZSE:002709)

Key Insights
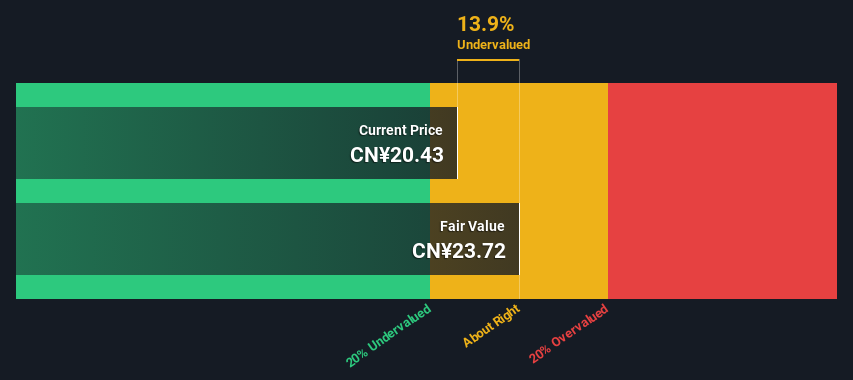
- The projected fair value for Guangzhou Tinci Materials Technology is CN¥23.72 based on 2 Stage Free Cash Flow to Equity
- With CN¥20.43 share price, Guangzhou Tinci Materials Technology appears to be trading close to its estimated fair value
- The CN¥22.09 analyst price target for 2709 is 6.9% less than our estimate of fair value
Does the April share price for Guangzhou Tinci Materials Technology Co., Ltd. (SZSE:002709) reflect what it's really worth? Today, we will estimate the stock's intrinsic value by estimating the company's future cash flows and discounting them to their present value. We will take advantage of the Discounted Cash Flow (DCF) model for this purpose. Don't get put off by the jargon, the math behind it is actually quite straightforward.
We would caution that there are many ways of valuing a company and, like the DCF, each technique has advantages and disadvantages in certain scenarios. If you want to learn more about discounted cash flow, the rationale behind this calculation can be read in detail in the Simply Wall St analysis model.
View our latest analysis for Guangzhou Tinci Materials Technology
What's The Estimated Valuation?
We're using the 2-stage growth model, which simply means we take in account two stages of company's growth. In the initial period the company may have a higher growth rate and the second stage is usually assumed to have a stable growth rate. To begin with, we have to get estimates of the next ten years of cash flows. Where possible we use analyst estimates, but when these aren't available we extrapolate the previous free cash flow (FCF) from the last estimate or reported value. We assume companies with shrinking free cash flow will slow their rate of shrinkage, and that companies with growing free cash flow will see their growth rate slow, over this period. We do this to reflect that growth tends to slow more in the early years than it does in later years.
Generally we assume that a dollar today is more valuable than a dollar in the future, and so the sum of these future cash flows is then discounted to today's value:
10-year free cash flow (FCF) estimate
| 2024 | 2025 | 2026 | 2027 | 2028 | 2029 | 2030 | 2031 | 2032 | 2033 | |
| Levered FCF (CN¥, Millions) | CN¥804.0m | CN¥1.33b | CN¥1.76b | CN¥2.18b | CN¥2.56b | CN¥2.90b | CN¥3.19b | CN¥3.45b | CN¥3.67b | CN¥3.87b |
| Growth Rate Estimate Source | Analyst x1 | Analyst x1 | Est @ 32.65% | Est @ 23.74% | Est @ 17.50% | Est @ 13.13% | Est @ 10.07% | Est @ 7.93% | Est @ 6.44% | Est @ 5.39% |
| Present Value (CN¥, Millions) Discounted @ 8.7% | CN¥740 | CN¥1.1k | CN¥1.4k | CN¥1.6k | CN¥1.7k | CN¥1.8k | CN¥1.8k | CN¥1.8k | CN¥1.7k | CN¥1.7k |
("Est" = FCF growth rate estimated by Simply Wall St)
Present Value of 10-year Cash Flow (PVCF) = CN¥15b
The second stage is also known as Terminal Value, this is the business's cash flow after the first stage. The Gordon Growth formula is used to calculate Terminal Value at a future annual growth rate equal to the 5-year average of the 10-year government bond yield of 2.9%. We discount the terminal cash flows to today's value at a cost of equity of 8.7%.
Terminal Value (TV)= FCF2033 × (1 + g) ÷ (r – g) = CN¥3.9b× (1 + 2.9%) ÷ (8.7%– 2.9%) = CN¥69b
Present Value of Terminal Value (PVTV)= TV / (1 + r)10= CN¥69b÷ ( 1 + 8.7%)10= CN¥30b
The total value, or equity value, is then the sum of the present value of the future cash flows, which in this case is CN¥45b. In the final step we divide the equity value by the number of shares outstanding. Relative to the current share price of CN¥20.4, the company appears about fair value at a 14% discount to where the stock price trades currently. Remember though, that this is just an approximate valuation, and like any complex formula - garbage in, garbage out.
Important Assumptions
Now the most important inputs to a discounted cash flow are the discount rate, and of course, the actual cash flows. If you don't agree with these result, have a go at the calculation yourself and play with the assumptions. The DCF also does not consider the possible cyclicality of an industry, or a company's future capital requirements, so it does not give a full picture of a company's potential performance. Given that we are looking at Guangzhou Tinci Materials Technology as potential shareholders, the cost of equity is used as the discount rate, rather than the cost of capital (or weighted average cost of capital, WACC) which accounts for debt. In this calculation we've used 8.7%, which is based on a levered beta of 1.019. Beta is a measure of a stock's volatility, compared to the market as a whole. We get our beta from the industry average beta of globally comparable companies, with an imposed limit between 0.8 and 2.0, which is a reasonable range for a stable business.
SWOT Analysis for Guangzhou Tinci Materials Technology
Strength
- Debt is not viewed as a risk.
Weakness
- Earnings declined over the past year.
- Dividend is low compared to the top 25% of dividend payers in the Chemicals market.
Opportunity
- Annual revenue is forecast to grow faster than the Chinese market.
- Current share price is below our estimate of fair value.
Threat
- Paying a dividend but company has no free cash flows.
- Annual earnings are forecast to grow slower than the Chinese market.
Moving On:
Whilst important, the DCF calculation ideally won't be the sole piece of analysis you scrutinize for a company. DCF models are not the be-all and end-all of investment valuation. Preferably you'd apply different cases and assumptions and see how they would impact the company's valuation. For example, changes in the company's cost of equity or the risk free rate can significantly impact the valuation. For Guangzhou Tinci Materials Technology, we've compiled three additional aspects you should consider:
- Risks: Case in point, we've spotted 2 warning signs for Guangzhou Tinci Materials Technology you should be aware of.
- Future Earnings: How does 002709's growth rate compare to its peers and the wider market? Dig deeper into the analyst consensus number for the upcoming years by interacting with our free analyst growth expectation chart.
- Other High Quality Alternatives: Do you like a good all-rounder? Explore our interactive list of high quality stocks to get an idea of what else is out there you may be missing!
PS. Simply Wall St updates its DCF calculation for every Chinese stock every day, so if you want to find the intrinsic value of any other stock just search here.
New: Manage All Your Stock Portfolios in One Place
We've created the ultimate portfolio companion for stock investors, and it's free.
• Connect an unlimited number of Portfolios and see your total in one currency
• Be alerted to new Warning Signs or Risks via email or mobile
• Track the Fair Value of your stocks
Have feedback on this article? Concerned about the content? Get in touch with us directly. Alternatively, email editorial-team (at) simplywallst.com.
This article by Simply Wall St is general in nature. We provide commentary based on historical data and analyst forecasts only using an unbiased methodology and our articles are not intended to be financial advice. It does not constitute a recommendation to buy or sell any stock, and does not take account of your objectives, or your financial situation. We aim to bring you long-term focused analysis driven by fundamental data. Note that our analysis may not factor in the latest price-sensitive company announcements or qualitative material. Simply Wall St has no position in any stocks mentioned.
About SZSE:002709
Guangzhou Tinci Materials Technology
Guangzhou Tinci Materials Technology Co., Ltd.
High growth potential with excellent balance sheet.
Market Insights


Advertisement
Community Narratives
Nike's Direct-to-Consumer Focus Will Drive Future Growth
Fair Value US$87.90|22.7% undervalued
UN
Community Contributor
Novo Nordisk will dominate GLP-1 market with Ozempic and Wegovy growth
Fair Value US$89.59|14.2% undervalued
BE
Community Contributor
Rheinmetall could get 20-25% of EU-NATO 3%-GDP defence spending
Fair Value €7.57k|82.8% undervalued
NO
Community Contributor