- China
- /
- Metals and Mining
- /
- SZSE:002428
Yunnan Lincang Xinyuan Germanium Industry Co.,LTD's (SZSE:002428) 26% Dip Still Leaving Some Shareholders Feeling Restless Over Its P/SRatio

Yunnan Lincang Xinyuan Germanium Industry Co.,LTD (SZSE:002428) shares have retraced a considerable 26% in the last month, reversing a fair amount of their solid recent performance. Looking at the bigger picture, even after this poor month the stock is up 51% in the last year.
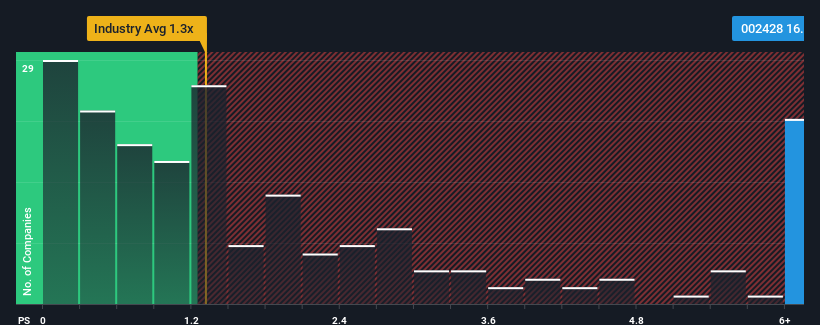
Even after such a large drop in price, you could still be forgiven for thinking Yunnan Lincang Xinyuan Germanium IndustryLTD is a stock to steer clear of with a price-to-sales ratios (or "P/S") of 16.4x, considering almost half the companies in China's Metals and Mining industry have P/S ratios below 1.3x. Although, it's not wise to just take the P/S at face value as there may be an explanation why it's so lofty.
See our latest analysis for Yunnan Lincang Xinyuan Germanium IndustryLTD

What Does Yunnan Lincang Xinyuan Germanium IndustryLTD's P/S Mean For Shareholders?
Yunnan Lincang Xinyuan Germanium IndustryLTD certainly has been doing a good job lately as it's been growing revenue more than most other companies. It seems the market expects this form will continue into the future, hence the elevated P/S ratio. You'd really hope so, otherwise you're paying a pretty hefty price for no particular reason.
If you'd like to see what analysts are forecasting going forward, you should check out our free report on Yunnan Lincang Xinyuan Germanium IndustryLTD.How Is Yunnan Lincang Xinyuan Germanium IndustryLTD's Revenue Growth Trending?
Yunnan Lincang Xinyuan Germanium IndustryLTD's P/S ratio would be typical for a company that's expected to deliver very strong growth, and importantly, perform much better than the industry.
Taking a look back first, we see that the company grew revenue by an impressive 18% last year. The latest three year period has also seen a 28% overall rise in revenue, aided extensively by its short-term performance. Accordingly, shareholders would have probably been satisfied with the medium-term rates of revenue growth.
Looking ahead now, revenue is anticipated to climb by 11% during the coming year according to the lone analyst following the company. Meanwhile, the rest of the industry is forecast to expand by 14%, which is noticeably more attractive.
With this in consideration, we believe it doesn't make sense that Yunnan Lincang Xinyuan Germanium IndustryLTD's P/S is outpacing its industry peers. It seems most investors are hoping for a turnaround in the company's business prospects, but the analyst cohort is not so confident this will happen. Only the boldest would assume these prices are sustainable as this level of revenue growth is likely to weigh heavily on the share price eventually.
The Key Takeaway
Yunnan Lincang Xinyuan Germanium IndustryLTD's shares may have suffered, but its P/S remains high. While the price-to-sales ratio shouldn't be the defining factor in whether you buy a stock or not, it's quite a capable barometer of revenue expectations.
It comes as a surprise to see Yunnan Lincang Xinyuan Germanium IndustryLTD trade at such a high P/S given the revenue forecasts look less than stellar. When we see a weak revenue outlook, we suspect the share price faces a much greater risk of declining, bringing back down the P/S figures. Unless these conditions improve markedly, it's very challenging to accept these prices as being reasonable.
You always need to take note of risks, for example - Yunnan Lincang Xinyuan Germanium IndustryLTD has 2 warning signs we think you should be aware of.
If these risks are making you reconsider your opinion on Yunnan Lincang Xinyuan Germanium IndustryLTD, explore our interactive list of high quality stocks to get an idea of what else is out there.
New: Manage All Your Stock Portfolios in One Place
We've created the ultimate portfolio companion for stock investors, and it's free.
• Connect an unlimited number of Portfolios and see your total in one currency
• Be alerted to new Warning Signs or Risks via email or mobile
• Track the Fair Value of your stocks
Have feedback on this article? Concerned about the content? Get in touch with us directly. Alternatively, email editorial-team (at) simplywallst.com.
This article by Simply Wall St is general in nature. We provide commentary based on historical data and analyst forecasts only using an unbiased methodology and our articles are not intended to be financial advice. It does not constitute a recommendation to buy or sell any stock, and does not take account of your objectives, or your financial situation. We aim to bring you long-term focused analysis driven by fundamental data. Note that our analysis may not factor in the latest price-sensitive company announcements or qualitative material. Simply Wall St has no position in any stocks mentioned.
About SZSE:002428
Yunnan Lincang Xinyuan Germanium IndustryLTD
Engages in the research and development, deep processing, germanium mining, pyrometallurgical enrichment, hydrometallurgical purification, and zone melting refining in China.
Proven track record with mediocre balance sheet.
Market Insights
Community Narratives


