- China
- /
- Metals and Mining
- /
- SZSE:000831
China Rare Earth Resources And Technology Co., Ltd.'s (SZSE:000831) Intrinsic Value Is Potentially 42% Above Its Share Price


Key Insights
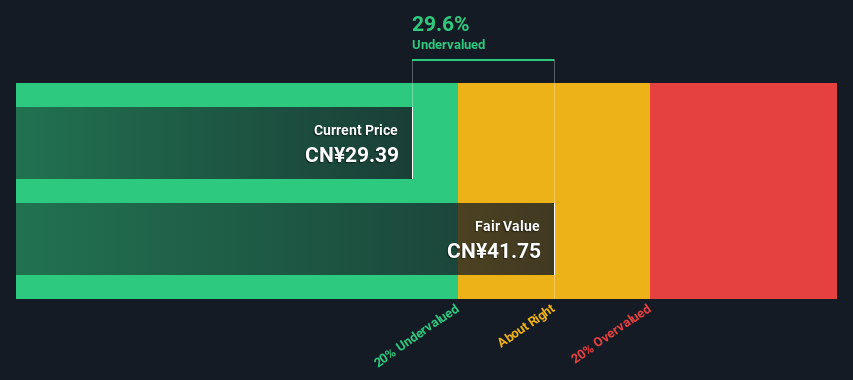
- China Rare Earth Resources And Technology's estimated fair value is CN¥41.75 based on 2 Stage Free Cash Flow to Equity
- Current share price of CN¥29.39 suggests China Rare Earth Resources And Technology is potentially 30% undervalued
- Peers of China Rare Earth Resources And Technology are currently trading on average at a 221% premium
Does the April share price for China Rare Earth Resources And Technology Co., Ltd. (SZSE:000831) reflect what it's really worth? Today, we will estimate the stock's intrinsic value by projecting its future cash flows and then discounting them to today's value. This will be done using the Discounted Cash Flow (DCF) model. It may sound complicated, but actually it is quite simple!
We would caution that there are many ways of valuing a company and, like the DCF, each technique has advantages and disadvantages in certain scenarios. If you still have some burning questions about this type of valuation, take a look at the Simply Wall St analysis model.
Check out our latest analysis for China Rare Earth Resources And Technology
The Method
We're using the 2-stage growth model, which simply means we take in account two stages of company's growth. In the initial period the company may have a higher growth rate and the second stage is usually assumed to have a stable growth rate. In the first stage we need to estimate the cash flows to the business over the next ten years. Seeing as no analyst estimates of free cash flow are available to us, we have extrapolate the previous free cash flow (FCF) from the company's last reported value. We assume companies with shrinking free cash flow will slow their rate of shrinkage, and that companies with growing free cash flow will see their growth rate slow, over this period. We do this to reflect that growth tends to slow more in the early years than it does in later years.
A DCF is all about the idea that a dollar in the future is less valuable than a dollar today, so we need to discount the sum of these future cash flows to arrive at a present value estimate:
10-year free cash flow (FCF) forecast
| 2024 | 2025 | 2026 | 2027 | 2028 | 2029 | 2030 | 2031 | 2032 | 2033 | |
| Levered FCF (CN¥, Millions) | CN¥751.9m | CN¥1.17b | CN¥1.63b | CN¥2.09b | CN¥2.53b | CN¥2.92b | CN¥3.26b | CN¥3.56b | CN¥3.82b | CN¥4.04b |
| Growth Rate Estimate Source | Est @ 77.57% | Est @ 55.18% | Est @ 39.51% | Est @ 28.54% | Est @ 20.86% | Est @ 15.48% | Est @ 11.72% | Est @ 9.09% | Est @ 7.24% | Est @ 5.95% |
| Present Value (CN¥, Millions) Discounted @ 9.4% | CN¥687 | CN¥975 | CN¥1.2k | CN¥1.5k | CN¥1.6k | CN¥1.7k | CN¥1.7k | CN¥1.7k | CN¥1.7k | CN¥1.7k |
("Est" = FCF growth rate estimated by Simply Wall St)
Present Value of 10-year Cash Flow (PVCF) = CN¥15b
The second stage is also known as Terminal Value, this is the business's cash flow after the first stage. For a number of reasons a very conservative growth rate is used that cannot exceed that of a country's GDP growth. In this case we have used the 5-year average of the 10-year government bond yield (2.9%) to estimate future growth. In the same way as with the 10-year 'growth' period, we discount future cash flows to today's value, using a cost of equity of 9.4%.
Terminal Value (TV)= FCF2033 × (1 + g) ÷ (r – g) = CN¥4.0b× (1 + 2.9%) ÷ (9.4%– 2.9%) = CN¥65b
Present Value of Terminal Value (PVTV)= TV / (1 + r)10= CN¥65b÷ ( 1 + 9.4%)10= CN¥26b
The total value, or equity value, is then the sum of the present value of the future cash flows, which in this case is CN¥41b. The last step is to then divide the equity value by the number of shares outstanding. Relative to the current share price of CN¥29.4, the company appears a touch undervalued at a 30% discount to where the stock price trades currently. Valuations are imprecise instruments though, rather like a telescope - move a few degrees and end up in a different galaxy. Do keep this in mind.
Important Assumptions
We would point out that the most important inputs to a discounted cash flow are the discount rate and of course the actual cash flows. If you don't agree with these result, have a go at the calculation yourself and play with the assumptions. The DCF also does not consider the possible cyclicality of an industry, or a company's future capital requirements, so it does not give a full picture of a company's potential performance. Given that we are looking at China Rare Earth Resources And Technology as potential shareholders, the cost of equity is used as the discount rate, rather than the cost of capital (or weighted average cost of capital, WACC) which accounts for debt. In this calculation we've used 9.4%, which is based on a levered beta of 1.142. Beta is a measure of a stock's volatility, compared to the market as a whole. We get our beta from the industry average beta of globally comparable companies, with an imposed limit between 0.8 and 2.0, which is a reasonable range for a stable business.
SWOT Analysis for China Rare Earth Resources And Technology
- Debt is not viewed as a risk.
- Earnings declined over the past year.
- Dividend is low compared to the top 25% of dividend payers in the Metals and Mining market.
- Annual earnings are forecast to grow faster than the Chinese market.
- Trading below our estimate of fair value by more than 20%.
- No apparent threats visible for 000831.
Looking Ahead:
Valuation is only one side of the coin in terms of building your investment thesis, and it ideally won't be the sole piece of analysis you scrutinize for a company. DCF models are not the be-all and end-all of investment valuation. Preferably you'd apply different cases and assumptions and see how they would impact the company's valuation. If a company grows at a different rate, or if its cost of equity or risk free rate changes sharply, the output can look very different. What is the reason for the share price sitting below the intrinsic value? For China Rare Earth Resources And Technology, we've put together three additional items you should look at:
- Risks: Case in point, we've spotted 2 warning signs for China Rare Earth Resources And Technology you should be aware of.
- Future Earnings: How does 000831's growth rate compare to its peers and the wider market? Dig deeper into the analyst consensus number for the upcoming years by interacting with our free analyst growth expectation chart.
- Other High Quality Alternatives: Do you like a good all-rounder? Explore our interactive list of high quality stocks to get an idea of what else is out there you may be missing!
PS. Simply Wall St updates its DCF calculation for every Chinese stock every day, so if you want to find the intrinsic value of any other stock just search here.
New: AI Stock Screener & Alerts
Our new AI Stock Screener scans the market every day to uncover opportunities.
• Dividend Powerhouses (3%+ Yield)
• Undervalued Small Caps with Insider Buying
• High growth Tech and AI Companies
Or build your own from over 50 metrics.
Have feedback on this article? Concerned about the content? Get in touch with us directly. Alternatively, email editorial-team (at) simplywallst.com.
This article by Simply Wall St is general in nature. We provide commentary based on historical data and analyst forecasts only using an unbiased methodology and our articles are not intended to be financial advice. It does not constitute a recommendation to buy or sell any stock, and does not take account of your objectives, or your financial situation. We aim to bring you long-term focused analysis driven by fundamental data. Note that our analysis may not factor in the latest price-sensitive company announcements or qualitative material. Simply Wall St has no position in any stocks mentioned.
About SZSE:000831
China Rare Earth Resources And Technology
China Rare Earth Resources And Technology Co., Ltd.
Reasonable growth potential with adequate balance sheet.
Market Insights

Community Narratives

