
Advertisement
Tianjin Jiuri New Materials Co., Ltd. (SHSE:688199) Soars 25% But It's A Story Of Risk Vs Reward
Those holding Tianjin Jiuri New Materials Co., Ltd. (SHSE:688199) shares would be relieved that the share price has rebounded 25% in the last thirty days, but it needs to keep going to repair the recent damage it has caused to investor portfolios. Unfortunately, the gains of the last month did little to right the losses of the last year with the stock still down 47% over that time.
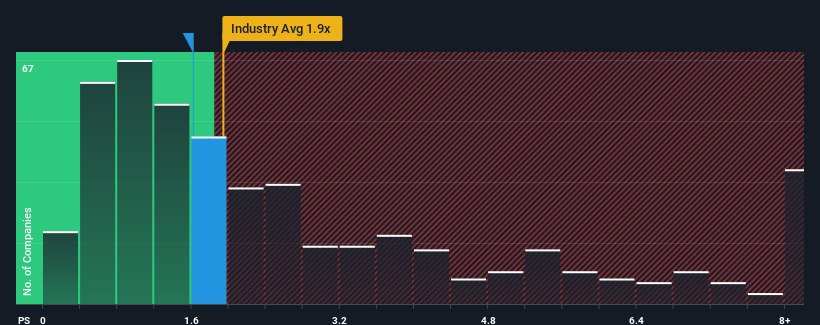
Even after such a large jump in price, you could still be forgiven for feeling indifferent about Tianjin Jiuri New Materials' P/S ratio of 1.6x, since the median price-to-sales (or "P/S") ratio for the Chemicals industry in China is also close to 1.9x. While this might not raise any eyebrows, if the P/S ratio is not justified investors could be missing out on a potential opportunity or ignoring looming disappointment.
Check out our latest analysis for Tianjin Jiuri New Materials
What Does Tianjin Jiuri New Materials' Recent Performance Look Like?
Tianjin Jiuri New Materials hasn't been tracking well recently as its declining revenue compares poorly to other companies, which have seen some growth in their revenues on average. It might be that many expect the dour revenue performance to strengthen positively, which has kept the P/S from falling. You'd really hope so, otherwise you're paying a relatively elevated price for a company with this sort of growth profile.
If you'd like to see what analysts are forecasting going forward, you should check out our free report on Tianjin Jiuri New Materials.Do Revenue Forecasts Match The P/S Ratio?
In order to justify its P/S ratio, Tianjin Jiuri New Materials would need to produce growth that's similar to the industry.
Taking a look back first, the company's revenue growth last year wasn't something to get excited about as it posted a disappointing decline of 12%. Regardless, revenue has managed to lift by a handy 22% in aggregate from three years ago, thanks to the earlier period of growth. Although it's been a bumpy ride, it's still fair to say the revenue growth recently has been mostly respectable for the company.
Turning to the outlook, the next year should generate growth of 48% as estimated by the dual analysts watching the company. That's shaping up to be materially higher than the 25% growth forecast for the broader industry.
With this information, we find it interesting that Tianjin Jiuri New Materials is trading at a fairly similar P/S compared to the industry. Apparently some shareholders are skeptical of the forecasts and have been accepting lower selling prices.
What Does Tianjin Jiuri New Materials' P/S Mean For Investors?
Tianjin Jiuri New Materials appears to be back in favour with a solid price jump bringing its P/S back in line with other companies in the industry Using the price-to-sales ratio alone to determine if you should sell your stock isn't sensible, however it can be a practical guide to the company's future prospects.
Despite enticing revenue growth figures that outpace the industry, Tianjin Jiuri New Materials' P/S isn't quite what we'd expect. There could be some risks that the market is pricing in, which is preventing the P/S ratio from matching the positive outlook. At least the risk of a price drop looks to be subdued, but investors seem to think future revenue could see some volatility.
Many other vital risk factors can be found on the company's balance sheet. Our free balance sheet analysis for Tianjin Jiuri New Materials with six simple checks will allow you to discover any risks that could be an issue.
Of course, profitable companies with a history of great earnings growth are generally safer bets. So you may wish to see this free collection of other companies that have reasonable P/E ratios and have grown earnings strongly.
Valuation is complex, but we're here to simplify it.
Discover if Tianjin Jiuri New Materials might be undervalued or overvalued with our detailed analysis, featuring fair value estimates, potential risks, dividends, insider trades, and its financial condition.
Access Free AnalysisHave feedback on this article? Concerned about the content? Get in touch with us directly. Alternatively, email editorial-team (at) simplywallst.com.
This article by Simply Wall St is general in nature. We provide commentary based on historical data and analyst forecasts only using an unbiased methodology and our articles are not intended to be financial advice. It does not constitute a recommendation to buy or sell any stock, and does not take account of your objectives, or your financial situation. We aim to bring you long-term focused analysis driven by fundamental data. Note that our analysis may not factor in the latest price-sensitive company announcements or qualitative material. Simply Wall St has no position in any stocks mentioned.
About SHSE:688199
Tianjin Jiuri New Materials
Engages in the research and development, manufacture, and sale of UV curing and electronic chemical materials in China.
Reasonable growth potential with mediocre balance sheet.
Similar Companies
Market Insights

Advertisement
Weekly Picks
RO


RockeTeller on Santacruz Silver Mining ·
Crazy Undervalued 42 Baggers Silver Play (Active & Running Mine)
Fair Value:CA$8696.7% undervalued
24 followersusers have followed this narrative
6 commentsusers have commented on this narrative
7 likesusers have liked this narrative
RO


Robbo on Fiducian Group ·
Fiducian: Compliance Clouds or Value Opportunity?
Fair Value:AU$126.1% undervalued
3 followersusers have followed this narrative
0 commentsusers have commented on this narrative
0 likesusers have liked this narrative
WO

woodworthfund on Willamette Valley Vineyards ·
Willamette Valley Vineyards (WVVI): Not-So-Great Value
Fair Value:US$242.5% overvalued
5 followersusers have followed this narrative
0 commentsusers have commented on this narrative
1 likeusers have liked this narrative
Recently Updated Narratives
MA


MarkoVT on Alphabet ·
Positioned globally, partnered locally
Fair Value:US$390.1919.1% undervalued
1 followerusers have followed this narrative
0 commentsusers have commented on this narrative
0 likesusers have liked this narrative
JO


JohnJ on Worldline ·
When will fraudsters be investigated in depth. Fraud was ongoing in France too.
Fair Value:€0.5200.8% overvalued
1 followerusers have followed this narrative
0 commentsusers have commented on this narrative
0 likesusers have liked this narrative
MA

MarkoVT on Applied Digital ·
Staggered by dilution; positions for growth
Fair Value:US$35.4520.9% undervalued
5 followersusers have followed this narrative
0 commentsusers have commented on this narrative
0 likesusers have liked this narrative
Popular Narratives
TH


TheWallstreetKing on MicroVision ·
MicroVision will explode future revenue by 380.37% with a vision towards success
Fair Value:US$6098.6% undervalued
112 followersusers have followed this narrative
11 commentsusers have commented on this narrative
22 likesusers have liked this narrative
AN


AnalystConsensusTarget on NVIDIA ·
NVDA: Expanding AI Demand Will Drive Major Data Center Investments Through 2026
Fair Value:US$250.3927.5% undervalued
949 followersusers have followed this narrative
6 commentsusers have commented on this narrative
24 likesusers have liked this narrative
OS

oscargarcia on Alphabet ·
The company that turned a verb into a global necessity and basically runs the modern internet, digital ads, smartphones, maps, and AI.
Fair Value:US$3407.1% undervalued
148 followersusers have followed this narrative
6 commentsusers have commented on this narrative
18 likesusers have liked this narrative

