
Advertisement
Hangzhou Greenda Electronic Materials (SHSE:603931) Will Be Hoping To Turn Its Returns On Capital Around

Finding a business that has the potential to grow substantially is not easy, but it is possible if we look at a few key financial metrics. Typically, we'll want to notice a trend of growing return on capital employed (ROCE) and alongside that, an expanding base of capital employed. If you see this, it typically means it's a company with a great business model and plenty of profitable reinvestment opportunities. However, after briefly looking over the numbers, we don't think Hangzhou Greenda Electronic Materials (SHSE:603931) has the makings of a multi-bagger going forward, but let's have a look at why that may be.
Understanding Return On Capital Employed (ROCE)
For those that aren't sure what ROCE is, it measures the amount of pre-tax profits a company can generate from the capital employed in its business. The formula for this calculation on Hangzhou Greenda Electronic Materials is:
Return on Capital Employed = Earnings Before Interest and Tax (EBIT) ÷ (Total Assets - Current Liabilities)
0.11 = CN¥158m ÷ (CN¥1.6b - CN¥180m) (Based on the trailing twelve months to September 2023).
So, Hangzhou Greenda Electronic Materials has an ROCE of 11%. On its own, that's a standard return, however it's much better than the 6.0% generated by the Chemicals industry.
See our latest analysis for Hangzhou Greenda Electronic Materials
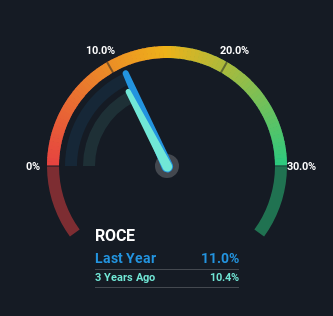
Historical performance is a great place to start when researching a stock so above you can see the gauge for Hangzhou Greenda Electronic Materials' ROCE against it's prior returns. If you'd like to look at how Hangzhou Greenda Electronic Materials has performed in the past in other metrics, you can view this free graph of Hangzhou Greenda Electronic Materials' past earnings, revenue and cash flow.
What Can We Tell From Hangzhou Greenda Electronic Materials' ROCE Trend?
In terms of Hangzhou Greenda Electronic Materials' historical ROCE movements, the trend isn't fantastic. Over the last five years, returns on capital have decreased to 11% from 21% five years ago. Given the business is employing more capital while revenue has slipped, this is a bit concerning. If this were to continue, you might be looking at a company that is trying to reinvest for growth but is actually losing market share since sales haven't increased.
On a side note, Hangzhou Greenda Electronic Materials has done well to pay down its current liabilities to 11% of total assets. So we could link some of this to the decrease in ROCE. Effectively this means their suppliers or short-term creditors are funding less of the business, which reduces some elements of risk. Since the business is basically funding more of its operations with it's own money, you could argue this has made the business less efficient at generating ROCE.
The Bottom Line On Hangzhou Greenda Electronic Materials' ROCE
We're a bit apprehensive about Hangzhou Greenda Electronic Materials because despite more capital being deployed in the business, returns on that capital and sales have both fallen. And, the stock has remained flat over the last three years, so investors don't seem too impressed either. Unless there is a shift to a more positive trajectory in these metrics, we would look elsewhere.
If you want to continue researching Hangzhou Greenda Electronic Materials, you might be interested to know about the 1 warning sign that our analysis has discovered.
While Hangzhou Greenda Electronic Materials may not currently earn the highest returns, we've compiled a list of companies that currently earn more than 25% return on equity. Check out this free list here.
Valuation is complex, but we're here to simplify it.
Discover if Hangzhou Greenda Electronic Materials might be undervalued or overvalued with our detailed analysis, featuring fair value estimates, potential risks, dividends, insider trades, and its financial condition.
Access Free AnalysisHave feedback on this article? Concerned about the content? Get in touch with us directly. Alternatively, email editorial-team (at) simplywallst.com.
This article by Simply Wall St is general in nature. We provide commentary based on historical data and analyst forecasts only using an unbiased methodology and our articles are not intended to be financial advice. It does not constitute a recommendation to buy or sell any stock, and does not take account of your objectives, or your financial situation. We aim to bring you long-term focused analysis driven by fundamental data. Note that our analysis may not factor in the latest price-sensitive company announcements or qualitative material. Simply Wall St has no position in any stocks mentioned.
About SHSE:603931
Hangzhou Greenda Electronic Materials
Hangzhou Greenda Electronic Materials Co., Ltd.
Flawless balance sheet second-rate dividend payer.
Similar Companies
Market Insights

Advertisement
Community Narratives
WhiteCap Is Positioned To Profit Regardless Of Trump's Policy 
Fair Value CA$22.60|61.7% undervalued
ST
Equity Analyst and Writer
Microsoft's Evolution Will Drive Revenue to New Heights Fueled by AI
Fair Value US$360.00|28.9% overvalued
BR
Community Contributor
A CASE FOR USD$2.50 (CAD$3.44) BY 2028 (A 5-10 BAGGER)
Fair Value CA$3.44|88.1% undervalued
AG
Community Contributor