
Advertisement
- China
- /
- Metals and Mining
- /
- SHSE:601958
An Intrinsic Calculation For Jinduicheng Molybdenum Co., Ltd. (SHSE:601958) Suggests It's 42% Undervalued

Key Insights
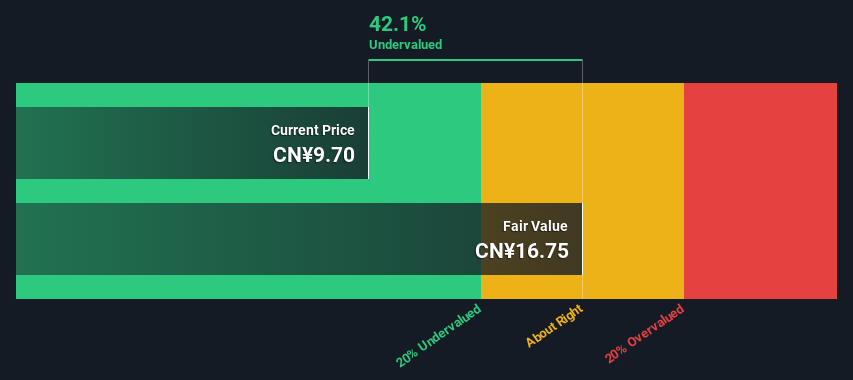
- Using the 2 Stage Free Cash Flow to Equity, Jinduicheng Molybdenum fair value estimate is CN¥16.75
- Jinduicheng Molybdenum's CN¥9.70 share price signals that it might be 42% undervalued
- Our fair value estimate is 11% higher than Jinduicheng Molybdenum's analyst price target of CN¥15.05
Today we will run through one way of estimating the intrinsic value of Jinduicheng Molybdenum Co., Ltd. (SHSE:601958) by projecting its future cash flows and then discounting them to today's value. We will take advantage of the Discounted Cash Flow (DCF) model for this purpose. It may sound complicated, but actually it is quite simple!
We would caution that there are many ways of valuing a company and, like the DCF, each technique has advantages and disadvantages in certain scenarios. If you still have some burning questions about this type of valuation, take a look at the Simply Wall St analysis model.
View our latest analysis for Jinduicheng Molybdenum
Is Jinduicheng Molybdenum Fairly Valued?
We're using the 2-stage growth model, which simply means we take in account two stages of company's growth. In the initial period the company may have a higher growth rate and the second stage is usually assumed to have a stable growth rate. To begin with, we have to get estimates of the next ten years of cash flows. Where possible we use analyst estimates, but when these aren't available we extrapolate the previous free cash flow (FCF) from the last estimate or reported value. We assume companies with shrinking free cash flow will slow their rate of shrinkage, and that companies with growing free cash flow will see their growth rate slow, over this period. We do this to reflect that growth tends to slow more in the early years than it does in later years.
Generally we assume that a dollar today is more valuable than a dollar in the future, and so the sum of these future cash flows is then discounted to today's value:
10-year free cash flow (FCF) estimate
| 2025 | 2026 | 2027 | 2028 | 2029 | 2030 | 2031 | 2032 | 2033 | 2034 | |
| Levered FCF (CN¥, Millions) | CN¥3.22b | CN¥3.47b | CN¥3.26b | CN¥3.27b | CN¥3.29b | CN¥3.34b | CN¥3.40b | CN¥3.47b | CN¥3.55b | CN¥3.64b |
| Growth Rate Estimate Source | Analyst x1 | Analyst x1 | Analyst x1 | Analyst x1 | Est @ 0.72% | Est @ 1.36% | Est @ 1.81% | Est @ 2.12% | Est @ 2.34% | Est @ 2.49% |
| Present Value (CN¥, Millions) Discounted @ 8.2% | CN¥3.0k | CN¥3.0k | CN¥2.6k | CN¥2.4k | CN¥2.2k | CN¥2.1k | CN¥2.0k | CN¥1.8k | CN¥1.7k | CN¥1.7k |
("Est" = FCF growth rate estimated by Simply Wall St)
Present Value of 10-year Cash Flow (PVCF) = CN¥22b
The second stage is also known as Terminal Value, this is the business's cash flow after the first stage. The Gordon Growth formula is used to calculate Terminal Value at a future annual growth rate equal to the 5-year average of the 10-year government bond yield of 2.9%. We discount the terminal cash flows to today's value at a cost of equity of 8.2%.
Terminal Value (TV)= FCF2034 × (1 + g) ÷ (r – g) = CN¥3.6b× (1 + 2.9%) ÷ (8.2%– 2.9%) = CN¥70b
Present Value of Terminal Value (PVTV)= TV / (1 + r)10= CN¥70b÷ ( 1 + 8.2%)10= CN¥32b
The total value is the sum of cash flows for the next ten years plus the discounted terminal value, which results in the Total Equity Value, which in this case is CN¥54b. To get the intrinsic value per share, we divide this by the total number of shares outstanding. Compared to the current share price of CN¥9.7, the company appears quite good value at a 42% discount to where the stock price trades currently. Valuations are imprecise instruments though, rather like a telescope - move a few degrees and end up in a different galaxy. Do keep this in mind.
The Assumptions
Now the most important inputs to a discounted cash flow are the discount rate, and of course, the actual cash flows. You don't have to agree with these inputs, I recommend redoing the calculations yourself and playing with them. The DCF also does not consider the possible cyclicality of an industry, or a company's future capital requirements, so it does not give a full picture of a company's potential performance. Given that we are looking at Jinduicheng Molybdenum as potential shareholders, the cost of equity is used as the discount rate, rather than the cost of capital (or weighted average cost of capital, WACC) which accounts for debt. In this calculation we've used 8.2%, which is based on a levered beta of 1.078. Beta is a measure of a stock's volatility, compared to the market as a whole. We get our beta from the industry average beta of globally comparable companies, with an imposed limit between 0.8 and 2.0, which is a reasonable range for a stable business.
SWOT Analysis for Jinduicheng Molybdenum
Strength
- Earnings growth over the past year exceeded the industry.
- Debt is not viewed as a risk.
- Dividends are covered by earnings and cash flows.
- Dividend is in the top 25% of dividend payers in the market.
Weakness
- Earnings growth over the past year is below its 5-year average.
Opportunity
- Annual earnings are forecast to grow for the next 3 years.
- Good value based on P/E ratio and estimated fair value.
Threat
- Annual earnings are forecast to grow slower than the Chinese market.
Looking Ahead:
Whilst important, the DCF calculation ideally won't be the sole piece of analysis you scrutinize for a company. It's not possible to obtain a foolproof valuation with a DCF model. Preferably you'd apply different cases and assumptions and see how they would impact the company's valuation. For example, changes in the company's cost of equity or the risk free rate can significantly impact the valuation. Can we work out why the company is trading at a discount to intrinsic value? For Jinduicheng Molybdenum, we've put together three important aspects you should consider:
- Risks: Every company has them, and we've spotted 1 warning sign for Jinduicheng Molybdenum you should know about.
- Future Earnings: How does 601958's growth rate compare to its peers and the wider market? Dig deeper into the analyst consensus number for the upcoming years by interacting with our free analyst growth expectation chart.
- Other Solid Businesses: Low debt, high returns on equity and good past performance are fundamental to a strong business. Why not explore our interactive list of stocks with solid business fundamentals to see if there are other companies you may not have considered!
PS. The Simply Wall St app conducts a discounted cash flow valuation for every stock on the SHSE every day. If you want to find the calculation for other stocks just search here.
New: Manage All Your Stock Portfolios in One Place
We've created the ultimate portfolio companion for stock investors, and it's free.
• Connect an unlimited number of Portfolios and see your total in one currency
• Be alerted to new Warning Signs or Risks via email or mobile
• Track the Fair Value of your stocks
Have feedback on this article? Concerned about the content? Get in touch with us directly. Alternatively, email editorial-team (at) simplywallst.com.
This article by Simply Wall St is general in nature. We provide commentary based on historical data and analyst forecasts only using an unbiased methodology and our articles are not intended to be financial advice. It does not constitute a recommendation to buy or sell any stock, and does not take account of your objectives, or your financial situation. We aim to bring you long-term focused analysis driven by fundamental data. Note that our analysis may not factor in the latest price-sensitive company announcements or qualitative material. Simply Wall St has no position in any stocks mentioned.
About SHSE:601958
Jinduicheng Molybdenum
Engages in the research and development, production, and sale of molybdenum series and trading of molybdenum-related products worldwide.
Flawless balance sheet, undervalued and pays a dividend.
Similar Companies
Market Insights


Advertisement
Community Narratives
Pole position to benefit from GENIUS Act
Fair Value US$233.04|58.8% undervalued
CH
Community Contributor
IREN will transform from bitcoin miner to leader in AI infrastructure
Fair Value US$21.48|17.5% undervalued
KA
Community Contributor
Behind the Assay: XRF Scientific’s Role in Modern Mining Economics
Fair Value AU$2.10|2.4% undervalued
RO
Community Contributor