- China
- /
- Metals and Mining
- /
- SHSE:601686
Returns On Capital At Tianjin You Fa Steel Pipe Group Stock (SHSE:601686) Paint A Concerning Picture


There are a few key trends to look for if we want to identify the next multi-bagger. In a perfect world, we'd like to see a company investing more capital into its business and ideally the returns earned from that capital are also increasing. Put simply, these types of businesses are compounding machines, meaning they are continually reinvesting their earnings at ever-higher rates of return. Having said that, from a first glance at Tianjin You Fa Steel Pipe Group Stock (SHSE:601686) we aren't jumping out of our chairs at how returns are trending, but let's have a deeper look.
Return On Capital Employed (ROCE): What Is It?
If you haven't worked with ROCE before, it measures the 'return' (pre-tax profit) a company generates from capital employed in its business. Analysts use this formula to calculate it for Tianjin You Fa Steel Pipe Group Stock:
Return on Capital Employed = Earnings Before Interest and Tax (EBIT) ÷ (Total Assets - Current Liabilities)
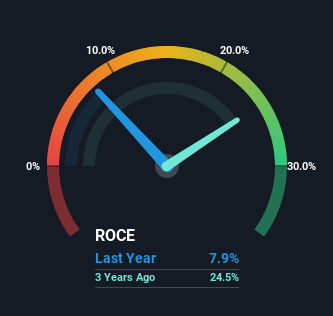
0.079 = CN¥805m ÷ (CN¥19b - CN¥8.6b) (Based on the trailing twelve months to September 2023).
Thus, Tianjin You Fa Steel Pipe Group Stock has an ROCE of 7.9%. In absolute terms, that's a low return but it's around the Metals and Mining industry average of 6.6%.
View our latest analysis for Tianjin You Fa Steel Pipe Group Stock
In the above chart we have measured Tianjin You Fa Steel Pipe Group Stock's prior ROCE against its prior performance, but the future is arguably more important. If you'd like to see what analysts are forecasting going forward, you should check out our free analyst report for Tianjin You Fa Steel Pipe Group Stock .
What The Trend Of ROCE Can Tell Us
On the surface, the trend of ROCE at Tianjin You Fa Steel Pipe Group Stock doesn't inspire confidence. To be more specific, ROCE has fallen from 16% over the last five years. And considering revenue has dropped while employing more capital, we'd be cautious. If this were to continue, you might be looking at a company that is trying to reinvest for growth but is actually losing market share since sales haven't increased.
On a separate but related note, it's important to know that Tianjin You Fa Steel Pipe Group Stock has a current liabilities to total assets ratio of 46%, which we'd consider pretty high. This effectively means that suppliers (or short-term creditors) are funding a large portion of the business, so just be aware that this can introduce some elements of risk. While it's not necessarily a bad thing, it can be beneficial if this ratio is lower.
The Key Takeaway
From the above analysis, we find it rather worrisome that returns on capital and sales for Tianjin You Fa Steel Pipe Group Stock have fallen, meanwhile the business is employing more capital than it was five years ago. Investors haven't taken kindly to these developments, since the stock has declined 51% from where it was three years ago. That being the case, unless the underlying trends revert to a more positive trajectory, we'd consider looking elsewhere.
If you'd like to know about the risks facing Tianjin You Fa Steel Pipe Group Stock, we've discovered 2 warning signs that you should be aware of.
While Tianjin You Fa Steel Pipe Group Stock isn't earning the highest return, check out this free list of companies that are earning high returns on equity with solid balance sheets.
If you're looking to trade Tianjin You Fa Steel Pipe Group Stock, open an account with the lowest-cost platform trusted by professionals, Interactive Brokers.
With clients in over 200 countries and territories, and access to 160 markets, IBKR lets you trade stocks, options, futures, forex, bonds and funds from a single integrated account.
Enjoy no hidden fees, no account minimums, and FX conversion rates as low as 0.03%, far better than what most brokers offer.
Sponsored ContentValuation is complex, but we're here to simplify it.
Discover if Tianjin You Fa Steel Pipe Group Stock might be undervalued or overvalued with our detailed analysis, featuring fair value estimates, potential risks, dividends, insider trades, and its financial condition.
Access Free AnalysisHave feedback on this article? Concerned about the content? Get in touch with us directly. Alternatively, email editorial-team (at) simplywallst.com.
This article by Simply Wall St is general in nature. We provide commentary based on historical data and analyst forecasts only using an unbiased methodology and our articles are not intended to be financial advice. It does not constitute a recommendation to buy or sell any stock, and does not take account of your objectives, or your financial situation. We aim to bring you long-term focused analysis driven by fundamental data. Note that our analysis may not factor in the latest price-sensitive company announcements or qualitative material. Simply Wall St has no position in any stocks mentioned.
About SHSE:601686
Tianjin You Fa Steel Pipe Group Stock
Tianjin You Fa Steel Pipe Group Stock Co., Ltd.
Excellent balance sheet and good value.
Market Insights

Community Narratives

