Investors Could Be Concerned With Shaanxi Beiyuan Chemical Industry Group's (SHSE:601568) Returns On Capital


If you're not sure where to start when looking for the next multi-bagger, there are a few key trends you should keep an eye out for. In a perfect world, we'd like to see a company investing more capital into its business and ideally the returns earned from that capital are also increasing. Put simply, these types of businesses are compounding machines, meaning they are continually reinvesting their earnings at ever-higher rates of return. However, after briefly looking over the numbers, we don't think Shaanxi Beiyuan Chemical Industry Group (SHSE:601568) has the makings of a multi-bagger going forward, but let's have a look at why that may be.
Return On Capital Employed (ROCE): What Is It?
Just to clarify if you're unsure, ROCE is a metric for evaluating how much pre-tax income (in percentage terms) a company earns on the capital invested in its business. To calculate this metric for Shaanxi Beiyuan Chemical Industry Group, this is the formula:
Return on Capital Employed = Earnings Before Interest and Tax (EBIT) ÷ (Total Assets - Current Liabilities)
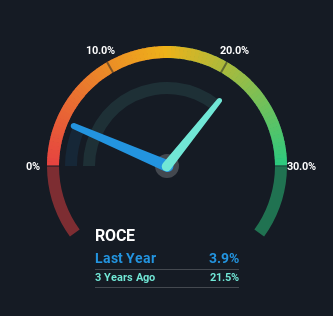
0.039 = CN¥510m ÷ (CN¥16b - CN¥2.7b) (Based on the trailing twelve months to September 2023).
Thus, Shaanxi Beiyuan Chemical Industry Group has an ROCE of 3.9%. Ultimately, that's a low return and it under-performs the Chemicals industry average of 5.7%.
View our latest analysis for Shaanxi Beiyuan Chemical Industry Group
While the past is not representative of the future, it can be helpful to know how a company has performed historically, which is why we have this chart above. If you'd like to look at how Shaanxi Beiyuan Chemical Industry Group has performed in the past in other metrics, you can view this free graph of Shaanxi Beiyuan Chemical Industry Group's past earnings, revenue and cash flow.
What Does the ROCE Trend For Shaanxi Beiyuan Chemical Industry Group Tell Us?
On the surface, the trend of ROCE at Shaanxi Beiyuan Chemical Industry Group doesn't inspire confidence. To be more specific, ROCE has fallen from 27% over the last five years. Given the business is employing more capital while revenue has slipped, this is a bit concerning. If this were to continue, you might be looking at a company that is trying to reinvest for growth but is actually losing market share since sales haven't increased.
On a related note, Shaanxi Beiyuan Chemical Industry Group has decreased its current liabilities to 17% of total assets. So we could link some of this to the decrease in ROCE. Effectively this means their suppliers or short-term creditors are funding less of the business, which reduces some elements of risk. Some would claim this reduces the business' efficiency at generating ROCE since it is now funding more of the operations with its own money.
The Bottom Line On Shaanxi Beiyuan Chemical Industry Group's ROCE
In summary, we're somewhat concerned by Shaanxi Beiyuan Chemical Industry Group's diminishing returns on increasing amounts of capital. Long term shareholders who've owned the stock over the last three years have experienced a 30% depreciation in their investment, so it appears the market might not like these trends either. Unless there is a shift to a more positive trajectory in these metrics, we would look elsewhere.
One final note, you should learn about the 4 warning signs we've spotted with Shaanxi Beiyuan Chemical Industry Group (including 2 which are significant) .
For those who like to invest in solid companies, check out this free list of companies with solid balance sheets and high returns on equity.
If you're looking to trade Shaanxi Beiyuan Chemical Industry Group, open an account with the lowest-cost platform trusted by professionals, Interactive Brokers.
With clients in over 200 countries and territories, and access to 160 markets, IBKR lets you trade stocks, options, futures, forex, bonds and funds from a single integrated account.
Enjoy no hidden fees, no account minimums, and FX conversion rates as low as 0.03%, far better than what most brokers offer.
Sponsored ContentNew: Manage All Your Stock Portfolios in One Place
We've created the ultimate portfolio companion for stock investors, and it's free.
• Connect an unlimited number of Portfolios and see your total in one currency
• Be alerted to new Warning Signs or Risks via email or mobile
• Track the Fair Value of your stocks
Have feedback on this article? Concerned about the content? Get in touch with us directly. Alternatively, email editorial-team (at) simplywallst.com.
This article by Simply Wall St is general in nature. We provide commentary based on historical data and analyst forecasts only using an unbiased methodology and our articles are not intended to be financial advice. It does not constitute a recommendation to buy or sell any stock, and does not take account of your objectives, or your financial situation. We aim to bring you long-term focused analysis driven by fundamental data. Note that our analysis may not factor in the latest price-sensitive company announcements or qualitative material. Simply Wall St has no position in any stocks mentioned.
About SHSE:601568
Shaanxi Beiyuan Chemical Industry Group
Shaanxi Beiyuan Chemical Industry Group Co., Ltd.
Excellent balance sheet low.

