- China
- /
- Metals and Mining
- /
- SHSE:601168
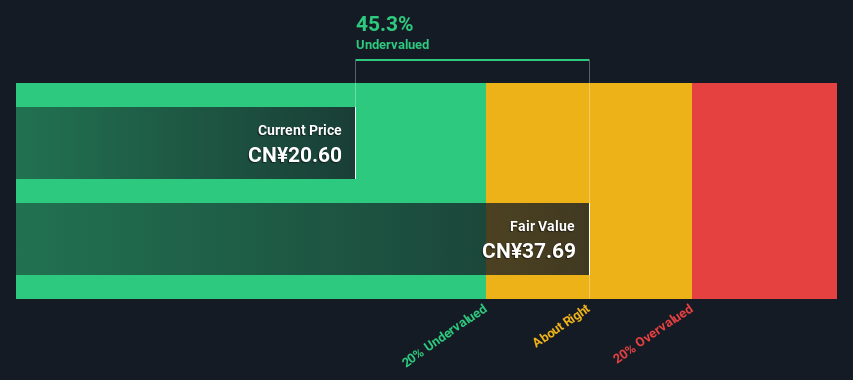
Is Western Mining Co.,Ltd. (SHSE:601168) Trading At A 45% Discount?


Key Insights
- Using the 2 Stage Free Cash Flow to Equity, Western MiningLtd fair value estimate is CN¥37.69
- Western MiningLtd's CN¥20.60 share price signals that it might be 45% undervalued
- The CN¥21.47 analyst price target for 601168 is 43% less than our estimate of fair value
Today we will run through one way of estimating the intrinsic value of Western Mining Co.,Ltd. (SHSE:601168) by projecting its future cash flows and then discounting them to today's value. One way to achieve this is by employing the Discounted Cash Flow (DCF) model. It may sound complicated, but actually it is quite simple!
Companies can be valued in a lot of ways, so we would point out that a DCF is not perfect for every situation. For those who are keen learners of equity analysis, the Simply Wall St analysis model here may be something of interest to you.
View our latest analysis for Western MiningLtd
Is Western MiningLtd Fairly Valued?
We use what is known as a 2-stage model, which simply means we have two different periods of growth rates for the company's cash flows. Generally the first stage is higher growth, and the second stage is a lower growth phase. In the first stage we need to estimate the cash flows to the business over the next ten years. Where possible we use analyst estimates, but when these aren't available we extrapolate the previous free cash flow (FCF) from the last estimate or reported value. We assume companies with shrinking free cash flow will slow their rate of shrinkage, and that companies with growing free cash flow will see their growth rate slow, over this period. We do this to reflect that growth tends to slow more in the early years than it does in later years.
A DCF is all about the idea that a dollar in the future is less valuable than a dollar today, so we discount the value of these future cash flows to their estimated value in today's dollars:
10-year free cash flow (FCF) forecast
| 2024 | 2025 | 2026 | 2027 | 2028 | 2029 | 2030 | 2031 | 2032 | 2033 | |
| Levered FCF (CN¥, Millions) | CN¥6.51b | CN¥7.30b | CN¥7.52b | CN¥7.74b | CN¥7.97b | CN¥8.21b | CN¥8.45b | CN¥8.70b | CN¥8.95b | CN¥9.22b |
| Growth Rate Estimate Source | Analyst x1 | Analyst x1 | Est @ 2.97% | Est @ 2.96% | Est @ 2.95% | Est @ 2.95% | Est @ 2.95% | Est @ 2.94% | Est @ 2.94% | Est @ 2.94% |
| Present Value (CN¥, Millions) Discounted @ 11% | CN¥5.9k | CN¥5.9k | CN¥5.5k | CN¥5.1k | CN¥4.8k | CN¥4.4k | CN¥4.1k | CN¥3.8k | CN¥3.6k | CN¥3.3k |
("Est" = FCF growth rate estimated by Simply Wall St)
Present Value of 10-year Cash Flow (PVCF) = CN¥47b
We now need to calculate the Terminal Value, which accounts for all the future cash flows after this ten year period. The Gordon Growth formula is used to calculate Terminal Value at a future annual growth rate equal to the 5-year average of the 10-year government bond yield of 2.9%. We discount the terminal cash flows to today's value at a cost of equity of 11%.
Terminal Value (TV)= FCF2033 × (1 + g) ÷ (r – g) = CN¥9.2b× (1 + 2.9%) ÷ (11%– 2.9%) = CN¥121b
Present Value of Terminal Value (PVTV)= TV / (1 + r)10= CN¥121b÷ ( 1 + 11%)10= CN¥43b
The total value is the sum of cash flows for the next ten years plus the discounted terminal value, which results in the Total Equity Value, which in this case is CN¥90b. To get the intrinsic value per share, we divide this by the total number of shares outstanding. Relative to the current share price of CN¥20.6, the company appears quite undervalued at a 45% discount to where the stock price trades currently. The assumptions in any calculation have a big impact on the valuation, so it is better to view this as a rough estimate, not precise down to the last cent.
Important Assumptions
Now the most important inputs to a discounted cash flow are the discount rate, and of course, the actual cash flows. If you don't agree with these result, have a go at the calculation yourself and play with the assumptions. The DCF also does not consider the possible cyclicality of an industry, or a company's future capital requirements, so it does not give a full picture of a company's potential performance. Given that we are looking at Western MiningLtd as potential shareholders, the cost of equity is used as the discount rate, rather than the cost of capital (or weighted average cost of capital, WACC) which accounts for debt. In this calculation we've used 11%, which is based on a levered beta of 1.396. Beta is a measure of a stock's volatility, compared to the market as a whole. We get our beta from the industry average beta of globally comparable companies, with an imposed limit between 0.8 and 2.0, which is a reasonable range for a stable business.
SWOT Analysis for Western MiningLtd
- Debt is well covered by earnings and cashflows.
- Dividends are covered by earnings and cash flows.
- Dividend is in the top 25% of dividend payers in the market.
- Earnings declined over the past year.
- Annual earnings are forecast to grow for the next 3 years.
- Good value based on P/E ratio and estimated fair value.
- Annual earnings are forecast to grow slower than the Chinese market.
Next Steps:
Whilst important, the DCF calculation ideally won't be the sole piece of analysis you scrutinize for a company. The DCF model is not a perfect stock valuation tool. Rather it should be seen as a guide to "what assumptions need to be true for this stock to be under/overvalued?" If a company grows at a different rate, or if its cost of equity or risk free rate changes sharply, the output can look very different. What is the reason for the share price sitting below the intrinsic value? For Western MiningLtd, we've compiled three pertinent elements you should further research:
- Risks: Consider for instance, the ever-present spectre of investment risk. We've identified 2 warning signs with Western MiningLtd , and understanding these should be part of your investment process.
- Future Earnings: How does 601168's growth rate compare to its peers and the wider market? Dig deeper into the analyst consensus number for the upcoming years by interacting with our free analyst growth expectation chart.
- Other High Quality Alternatives: Do you like a good all-rounder? Explore our interactive list of high quality stocks to get an idea of what else is out there you may be missing!
PS. Simply Wall St updates its DCF calculation for every Chinese stock every day, so if you want to find the intrinsic value of any other stock just search here.
Valuation is complex, but we're here to simplify it.
Discover if Western MiningLtd might be undervalued or overvalued with our detailed analysis, featuring fair value estimates, potential risks, dividends, insider trades, and its financial condition.
Access Free AnalysisHave feedback on this article? Concerned about the content? Get in touch with us directly. Alternatively, email editorial-team (at) simplywallst.com.
This article by Simply Wall St is general in nature. We provide commentary based on historical data and analyst forecasts only using an unbiased methodology and our articles are not intended to be financial advice. It does not constitute a recommendation to buy or sell any stock, and does not take account of your objectives, or your financial situation. We aim to bring you long-term focused analysis driven by fundamental data. Note that our analysis may not factor in the latest price-sensitive company announcements or qualitative material. Simply Wall St has no position in any stocks mentioned.
About SHSE:601168
Western MiningLtd
Engages in the mining, smelting, and trading of metals in Mainland China and internationally.
Very undervalued established dividend payer.
Similar Companies
Market Insights

Community Narratives

