
Advertisement
Is China Hainan Rubber Industry Group (SHSE:601118) Using Debt Sensibly?

The external fund manager backed by Berkshire Hathaway's Charlie Munger, Li Lu, makes no bones about it when he says 'The biggest investment risk is not the volatility of prices, but whether you will suffer a permanent loss of capital.' When we think about how risky a company is, we always like to look at its use of debt, since debt overload can lead to ruin. Importantly, China Hainan Rubber Industry Group Co., Ltd. (SHSE:601118) does carry debt. But the more important question is: how much risk is that debt creating?
What Risk Does Debt Bring?
Debt is a tool to help businesses grow, but if a business is incapable of paying off its lenders, then it exists at their mercy. If things get really bad, the lenders can take control of the business. However, a more frequent (but still costly) occurrence is where a company must issue shares at bargain-basement prices, permanently diluting shareholders, just to shore up its balance sheet. Of course, debt can be an important tool in businesses, particularly capital heavy businesses. When we think about a company's use of debt, we first look at cash and debt together.
Check out our latest analysis for China Hainan Rubber Industry Group
What Is China Hainan Rubber Industry Group's Debt?
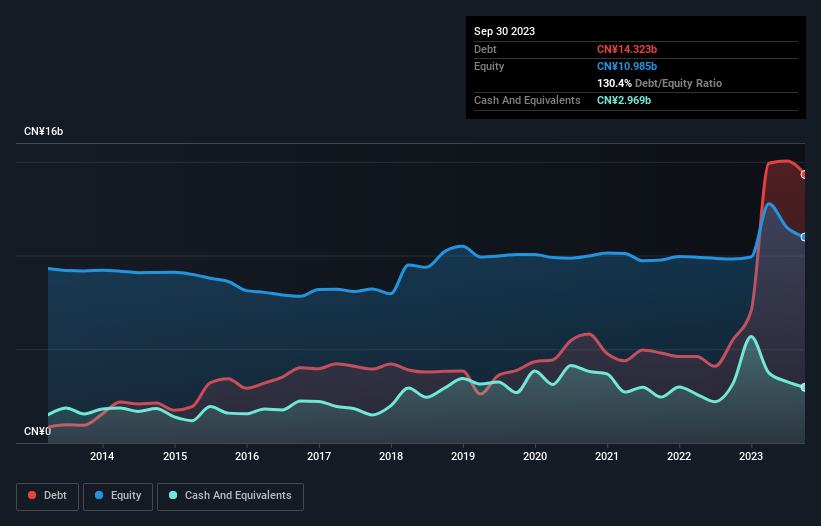
You can click the graphic below for the historical numbers, but it shows that as of September 2023 China Hainan Rubber Industry Group had CN¥14.3b of debt, an increase on CN¥5.51b, over one year. However, because it has a cash reserve of CN¥2.97b, its net debt is less, at about CN¥11.4b.
How Strong Is China Hainan Rubber Industry Group's Balance Sheet?
According to the last reported balance sheet, China Hainan Rubber Industry Group had liabilities of CN¥14.0b due within 12 months, and liabilities of CN¥8.18b due beyond 12 months. Offsetting this, it had CN¥2.97b in cash and CN¥2.79b in receivables that were due within 12 months. So its liabilities total CN¥16.4b more than the combination of its cash and short-term receivables.
This is a mountain of leverage relative to its market capitalization of CN¥19.2b. Should its lenders demand that it shore up the balance sheet, shareholders would likely face severe dilution. There's no doubt that we learn most about debt from the balance sheet. But it is China Hainan Rubber Industry Group's earnings that will influence how the balance sheet holds up in the future. So if you're keen to discover more about its earnings, it might be worth checking out this graph of its long term earnings trend.
In the last year China Hainan Rubber Industry Group wasn't profitable at an EBIT level, but managed to grow its revenue by 93%, to CN¥30b. Shareholders probably have their fingers crossed that it can grow its way to profits.
Caveat Emptor
While we can certainly appreciate China Hainan Rubber Industry Group's revenue growth, its earnings before interest and tax (EBIT) loss is not ideal. Indeed, it lost CN¥509m at the EBIT level. Considering that alongside the liabilities mentioned above does not give us much confidence that company should be using so much debt. Quite frankly we think the balance sheet is far from match-fit, although it could be improved with time. For example, we would not want to see a repeat of last year's loss of CN¥335m. So to be blunt we do think it is risky. When analysing debt levels, the balance sheet is the obvious place to start. However, not all investment risk resides within the balance sheet - far from it. For instance, we've identified 1 warning sign for China Hainan Rubber Industry Group that you should be aware of.
Of course, if you're the type of investor who prefers buying stocks without the burden of debt, then don't hesitate to discover our exclusive list of net cash growth stocks, today.
New: AI Stock Screener & Alerts
Our new AI Stock Screener scans the market every day to uncover opportunities.
• Dividend Powerhouses (3%+ Yield)
• Undervalued Small Caps with Insider Buying
• High growth Tech and AI Companies
Or build your own from over 50 metrics.
Have feedback on this article? Concerned about the content? Get in touch with us directly. Alternatively, email editorial-team (at) simplywallst.com.
This article by Simply Wall St is general in nature. We provide commentary based on historical data and analyst forecasts only using an unbiased methodology and our articles are not intended to be financial advice. It does not constitute a recommendation to buy or sell any stock, and does not take account of your objectives, or your financial situation. We aim to bring you long-term focused analysis driven by fundamental data. Note that our analysis may not factor in the latest price-sensitive company announcements or qualitative material. Simply Wall St has no position in any stocks mentioned.
About SHSE:601118
China Hainan Rubber Industry GroupLtd
China Hainan Rubber Industry Group Co., Ltd.
Reasonable growth potential low.
Similar Companies
Market Insights

Advertisement
Community Narratives
Groundbreaking therapies that could change the treatment landscape for PTSD, fibromyalgia, MS & Alzheimer’s
Fair Value US$6.20|86.8% undervalued
CM
Community Contributor
DigitalOcean Will Grow 14% by Embracing AI with Paperspace Acquisition
Fair Value US$50.00|43.5% undervalued
NE
Community Contributor
Viant Technology: A Rising AdTech Challenger in the AI-Powered CTV Market
Fair Value US$38.61|61.4% undervalued
BL
Community Contributor
Volvo will Accelerate Forward into Electric and Autonomous Leadership in Five Years
Fair Value SEK 438.80|40.8% undervalued
UN
Community Contributor