
Advertisement
Shan Dong Lu Bei Chemical Co.,Ltd's (SHSE:600727) Shares Bounce 30% But Its Business Still Trails The Industry
Shan Dong Lu Bei Chemical Co.,Ltd (SHSE:600727) shareholders are no doubt pleased to see that the share price has bounced 30% in the last month, although it is still struggling to make up recently lost ground. Unfortunately, the gains of the last month did little to right the losses of the last year with the stock still down 23% over that time.
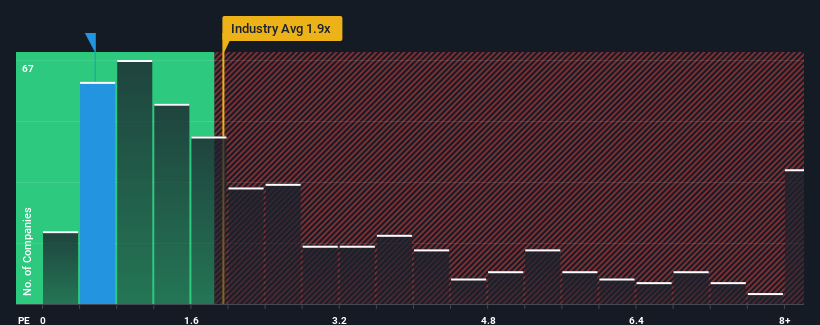
Although its price has surged higher, Shan Dong Lu Bei ChemicalLtd may still be sending bullish signals at the moment with its price-to-sales (or "P/S") ratio of 0.6x, since almost half of all companies in the Chemicals industry in China have P/S ratios greater than 1.9x and even P/S higher than 5x are not unusual. However, the P/S might be low for a reason and it requires further investigation to determine if it's justified.
Check out our latest analysis for Shan Dong Lu Bei ChemicalLtd
How Has Shan Dong Lu Bei ChemicalLtd Performed Recently?
We'd have to say that with no tangible growth over the last year, Shan Dong Lu Bei ChemicalLtd's revenue has been unimpressive. It might be that many expect the uninspiring revenue performance to worsen, which has repressed the P/S. If not, then existing shareholders may be feeling optimistic about the future direction of the share price.
Want the full picture on earnings, revenue and cash flow for the company? Then our free report on Shan Dong Lu Bei ChemicalLtd will help you shine a light on its historical performance.How Is Shan Dong Lu Bei ChemicalLtd's Revenue Growth Trending?
The only time you'd be truly comfortable seeing a P/S as low as Shan Dong Lu Bei ChemicalLtd's is when the company's growth is on track to lag the industry.
Taking a look back first, we see that there was hardly any revenue growth to speak of for the company over the past year. However, a few strong years before that means that it was still able to grow revenue by an impressive 70% in total over the last three years. Therefore, it's fair to say the revenue growth recently has been great for the company, but investors will want to ask why it has slowed to such an extent.
Comparing that to the industry, which is predicted to deliver 25% growth in the next 12 months, the company's momentum is weaker, based on recent medium-term annualised revenue results.
With this information, we can see why Shan Dong Lu Bei ChemicalLtd is trading at a P/S lower than the industry. It seems most investors are expecting to see the recent limited growth rates continue into the future and are only willing to pay a reduced amount for the stock.
What We Can Learn From Shan Dong Lu Bei ChemicalLtd's P/S?
Shan Dong Lu Bei ChemicalLtd's stock price has surged recently, but its but its P/S still remains modest. Typically, we'd caution against reading too much into price-to-sales ratios when settling on investment decisions, though it can reveal plenty about what other market participants think about the company.
In line with expectations, Shan Dong Lu Bei ChemicalLtd maintains its low P/S on the weakness of its recent three-year growth being lower than the wider industry forecast. Right now shareholders are accepting the low P/S as they concede future revenue probably won't provide any pleasant surprises. If recent medium-term revenue trends continue, it's hard to see the share price experience a reversal of fortunes anytime soon.
You should always think about risks. Case in point, we've spotted 1 warning sign for Shan Dong Lu Bei ChemicalLtd you should be aware of.
Of course, profitable companies with a history of great earnings growth are generally safer bets. So you may wish to see this free collection of other companies that have reasonable P/E ratios and have grown earnings strongly.
New: Manage All Your Stock Portfolios in One Place
We've created the ultimate portfolio companion for stock investors, and it's free.
• Connect an unlimited number of Portfolios and see your total in one currency
• Be alerted to new Warning Signs or Risks via email or mobile
• Track the Fair Value of your stocks
Have feedback on this article? Concerned about the content? Get in touch with us directly. Alternatively, email editorial-team (at) simplywallst.com.
This article by Simply Wall St is general in nature. We provide commentary based on historical data and analyst forecasts only using an unbiased methodology and our articles are not intended to be financial advice. It does not constitute a recommendation to buy or sell any stock, and does not take account of your objectives, or your financial situation. We aim to bring you long-term focused analysis driven by fundamental data. Note that our analysis may not factor in the latest price-sensitive company announcements or qualitative material. Simply Wall St has no position in any stocks mentioned.
About SHSE:600727
Shan Dong Lu Bei ChemicalLtd
Produces and sells various fertilizers and chemicals in China.
Proven track record with mediocre balance sheet.
Market Insights

Advertisement
Community Narratives
MicroStrategy: Volatile Gamble or Golden Opportunity?
Fair Value US$663.00|36.2% undervalued
BL
Community Contributor
Emerging Markets and Debt Reduction Will Propel Bath & Body Works Forward
Fair Value US$40.73|22.0% undervalued
ZW
Community Contributor
An amazing opportunity to potentially get a 100 bagger
Fair Value US$10.00|46.4% overvalued
DA
Community Contributor