- China
- /
- Basic Materials
- /
- SHSE:600539
Lionhead Technology Development Co., Ltd. (SHSE:600539) Stocks Pounded By 26% But Not Lagging Industry On Growth Or Pricing

To the annoyance of some shareholders, Lionhead Technology Development Co., Ltd. (SHSE:600539) shares are down a considerable 26% in the last month, which continues a horrid run for the company. The drop over the last 30 days has capped off a tough year for shareholders, with the share price down 29% in that time.
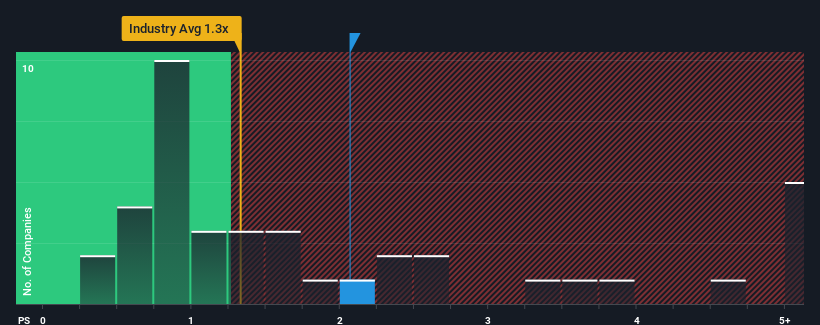
In spite of the heavy fall in price, when almost half of the companies in China's Basic Materials industry have price-to-sales ratios (or "P/S") below 1.3x, you may still consider Lionhead Technology Development as a stock probably not worth researching with its 2.1x P/S ratio. However, the P/S might be high for a reason and it requires further investigation to determine if it's justified.
See our latest analysis for Lionhead Technology Development

What Does Lionhead Technology Development's Recent Performance Look Like?
Lionhead Technology Development has been doing a decent job lately as it's been growing revenue at a reasonable pace. Perhaps the market believes the recent revenue performance is strong enough to outperform the industry, which has inflated the P/S ratio. However, if this isn't the case, investors might get caught out paying too much for the stock.
We don't have analyst forecasts, but you can see how recent trends are setting up the company for the future by checking out our free report on Lionhead Technology Development's earnings, revenue and cash flow.What Are Revenue Growth Metrics Telling Us About The High P/S?
The only time you'd be truly comfortable seeing a P/S as high as Lionhead Technology Development's is when the company's growth is on track to outshine the industry.
Retrospectively, the last year delivered a decent 5.2% gain to the company's revenues. Spectacularly, three year revenue growth has ballooned by several orders of magnitude, even though the last 12 months were fairly tame in comparison. So we can start by confirming that the company has done a tremendous job of growing revenue over that time.
This is in contrast to the rest of the industry, which is expected to grow by 20% over the next year, materially lower than the company's recent medium-term annualised growth rates.
With this information, we can see why Lionhead Technology Development is trading at such a high P/S compared to the industry. It seems most investors are expecting this strong growth to continue and are willing to pay more for the stock.
What Does Lionhead Technology Development's P/S Mean For Investors?
There's still some elevation in Lionhead Technology Development's P/S, even if the same can't be said for its share price recently. It's argued the price-to-sales ratio is an inferior measure of value within certain industries, but it can be a powerful business sentiment indicator.
We've established that Lionhead Technology Development maintains its high P/S on the strength of its recent three-year growth being higher than the wider industry forecast, as expected. In the eyes of shareholders, the probability of a continued growth trajectory is great enough to prevent the P/S from pulling back. Unless the recent medium-term conditions change, they will continue to provide strong support to the share price.
Many other vital risk factors can be found on the company's balance sheet. Take a look at our free balance sheet analysis for Lionhead Technology Development with six simple checks on some of these key factors.
If companies with solid past earnings growth is up your alley, you may wish to see this free collection of other companies with strong earnings growth and low P/E ratios.
New: AI Stock Screener & Alerts
Our new AI Stock Screener scans the market every day to uncover opportunities.
• Dividend Powerhouses (3%+ Yield)
• Undervalued Small Caps with Insider Buying
• High growth Tech and AI Companies
Or build your own from over 50 metrics.
Have feedback on this article? Concerned about the content? Get in touch with us directly. Alternatively, email editorial-team (at) simplywallst.com.
This article by Simply Wall St is general in nature. We provide commentary based on historical data and analyst forecasts only using an unbiased methodology and our articles are not intended to be financial advice. It does not constitute a recommendation to buy or sell any stock, and does not take account of your objectives, or your financial situation. We aim to bring you long-term focused analysis driven by fundamental data. Note that our analysis may not factor in the latest price-sensitive company announcements or qualitative material. Simply Wall St has no position in any stocks mentioned.
About SHSE:600539
Lionhead Technology DevelopmentLtd
Provides e-commerce services in China.
Excellent balance sheet minimal.
Market Insights
Community Narratives


