- China
- /
- Metals and Mining
- /
- SHSE:600219
Shandong Nanshan Aluminium Co.,Ltd.'s (SHSE:600219) Intrinsic Value Is Potentially 41% Above Its Share Price

Key Insights
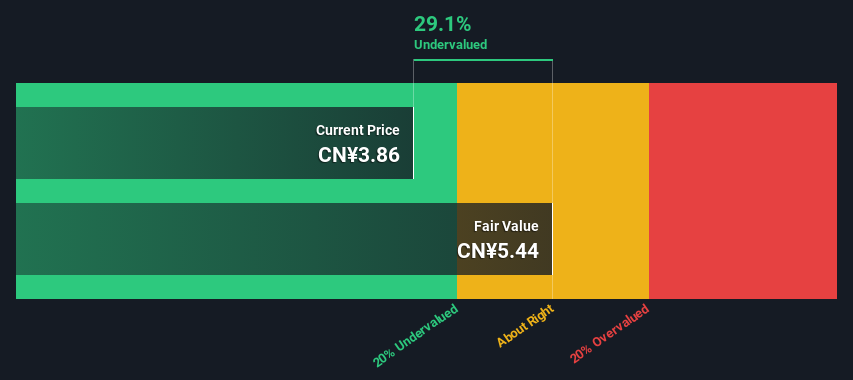
- Shandong Nanshan AluminiumLtd's estimated fair value is CN¥5.44 based on 2 Stage Free Cash Flow to Equity
- Shandong Nanshan AluminiumLtd's CN¥3.86 share price signals that it might be 29% undervalued
- Our fair value estimate is 13% higher than Shandong Nanshan AluminiumLtd's analyst price target of CN¥4.84
Today we'll do a simple run through of a valuation method used to estimate the attractiveness of Shandong Nanshan Aluminium Co.,Ltd. (SHSE:600219) as an investment opportunity by taking the forecast future cash flows of the company and discounting them back to today's value. We will take advantage of the Discounted Cash Flow (DCF) model for this purpose. Models like these may appear beyond the comprehension of a lay person, but they're fairly easy to follow.
We would caution that there are many ways of valuing a company and, like the DCF, each technique has advantages and disadvantages in certain scenarios. For those who are keen learners of equity analysis, the Simply Wall St analysis model here may be something of interest to you.
See our latest analysis for Shandong Nanshan AluminiumLtd
Step By Step Through The Calculation
We are going to use a two-stage DCF model, which, as the name states, takes into account two stages of growth. The first stage is generally a higher growth period which levels off heading towards the terminal value, captured in the second 'steady growth' period. To begin with, we have to get estimates of the next ten years of cash flows. Seeing as no analyst estimates of free cash flow are available to us, we have extrapolate the previous free cash flow (FCF) from the company's last reported value. We assume companies with shrinking free cash flow will slow their rate of shrinkage, and that companies with growing free cash flow will see their growth rate slow, over this period. We do this to reflect that growth tends to slow more in the early years than it does in later years.
A DCF is all about the idea that a dollar in the future is less valuable than a dollar today, so we need to discount the sum of these future cash flows to arrive at a present value estimate:
10-year free cash flow (FCF) forecast
| 2025 | 2026 | 2027 | 2028 | 2029 | 2030 | 2031 | 2032 | 2033 | 2034 | |
| Levered FCF (CN¥, Millions) | CN¥3.95b | CN¥3.99b | CN¥4.04b | CN¥4.12b | CN¥4.20b | CN¥4.30b | CN¥4.41b | CN¥4.52b | CN¥4.63b | CN¥4.75b |
| Growth Rate Estimate Source | Est @ 0.08% | Est @ 0.88% | Est @ 1.44% | Est @ 1.83% | Est @ 2.10% | Est @ 2.29% | Est @ 2.43% | Est @ 2.52% | Est @ 2.59% | Est @ 2.63% |
| Present Value (CN¥, Millions) Discounted @ 8.7% | CN¥3.6k | CN¥3.4k | CN¥3.1k | CN¥2.9k | CN¥2.8k | CN¥2.6k | CN¥2.5k | CN¥2.3k | CN¥2.2k | CN¥2.1k |
("Est" = FCF growth rate estimated by Simply Wall St)
Present Value of 10-year Cash Flow (PVCF) = CN¥27b
The second stage is also known as Terminal Value, this is the business's cash flow after the first stage. For a number of reasons a very conservative growth rate is used that cannot exceed that of a country's GDP growth. In this case we have used the 5-year average of the 10-year government bond yield (2.7%) to estimate future growth. In the same way as with the 10-year 'growth' period, we discount future cash flows to today's value, using a cost of equity of 8.7%.
Terminal Value (TV)= FCF2034 × (1 + g) ÷ (r – g) = CN¥4.8b× (1 + 2.7%) ÷ (8.7%– 2.7%) = CN¥82b
Present Value of Terminal Value (PVTV)= TV / (1 + r)10= CN¥82b÷ ( 1 + 8.7%)10= CN¥35b
The total value is the sum of cash flows for the next ten years plus the discounted terminal value, which results in the Total Equity Value, which in this case is CN¥63b. In the final step we divide the equity value by the number of shares outstanding. Compared to the current share price of CN¥3.9, the company appears a touch undervalued at a 29% discount to where the stock price trades currently. Remember though, that this is just an approximate valuation, and like any complex formula - garbage in, garbage out.
The Assumptions
We would point out that the most important inputs to a discounted cash flow are the discount rate and of course the actual cash flows. If you don't agree with these result, have a go at the calculation yourself and play with the assumptions. The DCF also does not consider the possible cyclicality of an industry, or a company's future capital requirements, so it does not give a full picture of a company's potential performance. Given that we are looking at Shandong Nanshan AluminiumLtd as potential shareholders, the cost of equity is used as the discount rate, rather than the cost of capital (or weighted average cost of capital, WACC) which accounts for debt. In this calculation we've used 8.7%, which is based on a levered beta of 1.133. Beta is a measure of a stock's volatility, compared to the market as a whole. We get our beta from the industry average beta of globally comparable companies, with an imposed limit between 0.8 and 2.0, which is a reasonable range for a stable business.
SWOT Analysis for Shandong Nanshan AluminiumLtd
- Earnings growth over the past year exceeded the industry.
- Debt is not viewed as a risk.
- Dividends are covered by earnings and cash flows.
- Dividend is low compared to the top 25% of dividend payers in the Metals and Mining market.
- Annual earnings are forecast to grow for the next 3 years.
- Good value based on P/E ratio and estimated fair value.
- Annual earnings are forecast to grow slower than the Chinese market.
Next Steps:
Whilst important, the DCF calculation ideally won't be the sole piece of analysis you scrutinize for a company. The DCF model is not a perfect stock valuation tool. Instead the best use for a DCF model is to test certain assumptions and theories to see if they would lead to the company being undervalued or overvalued. For example, changes in the company's cost of equity or the risk free rate can significantly impact the valuation. What is the reason for the share price sitting below the intrinsic value? For Shandong Nanshan AluminiumLtd, there are three further factors you should assess:
- Risks: Be aware that Shandong Nanshan AluminiumLtd is showing 2 warning signs in our investment analysis , you should know about...
- Future Earnings: How does 600219's growth rate compare to its peers and the wider market? Dig deeper into the analyst consensus number for the upcoming years by interacting with our free analyst growth expectation chart.
- Other Solid Businesses: Low debt, high returns on equity and good past performance are fundamental to a strong business. Why not explore our interactive list of stocks with solid business fundamentals to see if there are other companies you may not have considered!
PS. Simply Wall St updates its DCF calculation for every Chinese stock every day, so if you want to find the intrinsic value of any other stock just search here.
New: Manage All Your Stock Portfolios in One Place
We've created the ultimate portfolio companion for stock investors, and it's free.
• Connect an unlimited number of Portfolios and see your total in one currency
• Be alerted to new Warning Signs or Risks via email or mobile
• Track the Fair Value of your stocks
Have feedback on this article? Concerned about the content? Get in touch with us directly. Alternatively, email editorial-team (at) simplywallst.com.
This article by Simply Wall St is general in nature. We provide commentary based on historical data and analyst forecasts only using an unbiased methodology and our articles are not intended to be financial advice. It does not constitute a recommendation to buy or sell any stock, and does not take account of your objectives, or your financial situation. We aim to bring you long-term focused analysis driven by fundamental data. Note that our analysis may not factor in the latest price-sensitive company announcements or qualitative material. Simply Wall St has no position in any stocks mentioned.
About SHSE:600219
Shandong Nanshan AluminiumLtd
Researches and develops, manufactures, imports, sells, and exports aluminum profiles worldwide.
Very undervalued with flawless balance sheet and pays a dividend.
Similar Companies
Market Insights

Community Narratives

