- China
- /
- Personal Products
- /
- SHSE:600315
Shanghai Jahwa United Co., Ltd.'s (SHSE:600315) Intrinsic Value Is Potentially 18% Below Its Share Price


Key Insights
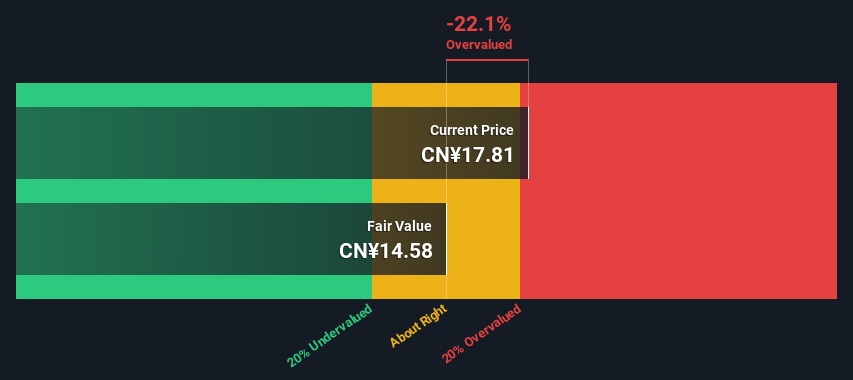
- Using the 2 Stage Free Cash Flow to Equity, Shanghai Jahwa United fair value estimate is CN¥14.58
- Shanghai Jahwa United is estimated to be 22% overvalued based on current share price of CN¥17.81
- The CN¥20.02 analyst price target for 600315 is 37% more than our estimate of fair value
Does the July share price for Shanghai Jahwa United Co., Ltd. (SHSE:600315) reflect what it's really worth? Today, we will estimate the stock's intrinsic value by projecting its future cash flows and then discounting them to today's value. The Discounted Cash Flow (DCF) model is the tool we will apply to do this. Believe it or not, it's not too difficult to follow, as you'll see from our example!
We generally believe that a company's value is the present value of all of the cash it will generate in the future. However, a DCF is just one valuation metric among many, and it is not without flaws. For those who are keen learners of equity analysis, the Simply Wall St analysis model here may be something of interest to you.
See our latest analysis for Shanghai Jahwa United
The Method
We are going to use a two-stage DCF model, which, as the name states, takes into account two stages of growth. The first stage is generally a higher growth period which levels off heading towards the terminal value, captured in the second 'steady growth' period. To start off with, we need to estimate the next ten years of cash flows. Where possible we use analyst estimates, but when these aren't available we extrapolate the previous free cash flow (FCF) from the last estimate or reported value. We assume companies with shrinking free cash flow will slow their rate of shrinkage, and that companies with growing free cash flow will see their growth rate slow, over this period. We do this to reflect that growth tends to slow more in the early years than it does in later years.
A DCF is all about the idea that a dollar in the future is less valuable than a dollar today, so we need to discount the sum of these future cash flows to arrive at a present value estimate:
10-year free cash flow (FCF) estimate
| 2025 | 2026 | 2027 | 2028 | 2029 | 2030 | 2031 | 2032 | 2033 | 2034 | |
| Levered FCF (CN¥, Millions) | CN¥720.1m | CN¥682.0m | CN¥664.1m | CN¥657.6m | CN¥658.9m | CN¥665.5m | CN¥676.0m | CN¥689.3m | CN¥704.8m | CN¥722.0m |
| Growth Rate Estimate Source | Analyst x5 | Analyst x4 | Est @ -2.63% | Est @ -0.97% | Est @ 0.19% | Est @ 1.00% | Est @ 1.57% | Est @ 1.97% | Est @ 2.25% | Est @ 2.44% |
| Present Value (CN¥, Millions) Discounted @ 8.8% | CN¥662 | CN¥576 | CN¥516 | CN¥470 | CN¥432 | CN¥402 | CN¥375 | CN¥351 | CN¥330 | CN¥311 |
("Est" = FCF growth rate estimated by Simply Wall St)
Present Value of 10-year Cash Flow (PVCF) = CN¥4.4b
We now need to calculate the Terminal Value, which accounts for all the future cash flows after this ten year period. The Gordon Growth formula is used to calculate Terminal Value at a future annual growth rate equal to the 5-year average of the 10-year government bond yield of 2.9%. We discount the terminal cash flows to today's value at a cost of equity of 8.8%.
Terminal Value (TV)= FCF2034 × (1 + g) ÷ (r – g) = CN¥722m× (1 + 2.9%) ÷ (8.8%– 2.9%) = CN¥13b
Present Value of Terminal Value (PVTV)= TV / (1 + r)10= CN¥13b÷ ( 1 + 8.8%)10= CN¥5.4b
The total value, or equity value, is then the sum of the present value of the future cash flows, which in this case is CN¥9.9b. To get the intrinsic value per share, we divide this by the total number of shares outstanding. Relative to the current share price of CN¥17.8, the company appears slightly overvalued at the time of writing. Remember though, that this is just an approximate valuation, and like any complex formula - garbage in, garbage out.
Important Assumptions
The calculation above is very dependent on two assumptions. The first is the discount rate and the other is the cash flows. You don't have to agree with these inputs, I recommend redoing the calculations yourself and playing with them. The DCF also does not consider the possible cyclicality of an industry, or a company's future capital requirements, so it does not give a full picture of a company's potential performance. Given that we are looking at Shanghai Jahwa United as potential shareholders, the cost of equity is used as the discount rate, rather than the cost of capital (or weighted average cost of capital, WACC) which accounts for debt. In this calculation we've used 8.8%, which is based on a levered beta of 1.046. Beta is a measure of a stock's volatility, compared to the market as a whole. We get our beta from the industry average beta of globally comparable companies, with an imposed limit between 0.8 and 2.0, which is a reasonable range for a stable business.
SWOT Analysis for Shanghai Jahwa United
- Earnings growth over the past year exceeded the industry.
- Debt is not viewed as a risk.
- Dividend is low compared to the top 25% of dividend payers in the Personal Products market.
- Expensive based on P/E ratio and estimated fair value.
- Annual earnings are forecast to grow for the next 3 years.
- Dividends are not covered by cash flow.
- Annual earnings are forecast to grow slower than the Chinese market.
Moving On:
Although the valuation of a company is important, it is only one of many factors that you need to assess for a company. The DCF model is not a perfect stock valuation tool. Preferably you'd apply different cases and assumptions and see how they would impact the company's valuation. For example, changes in the company's cost of equity or the risk free rate can significantly impact the valuation. What is the reason for the share price exceeding the intrinsic value? For Shanghai Jahwa United, we've compiled three pertinent factors you should assess:
- Risks: You should be aware of the 1 warning sign for Shanghai Jahwa United we've uncovered before considering an investment in the company.
- Future Earnings: How does 600315's growth rate compare to its peers and the wider market? Dig deeper into the analyst consensus number for the upcoming years by interacting with our free analyst growth expectation chart.
- Other High Quality Alternatives: Do you like a good all-rounder? Explore our interactive list of high quality stocks to get an idea of what else is out there you may be missing!
PS. The Simply Wall St app conducts a discounted cash flow valuation for every stock on the SHSE every day. If you want to find the calculation for other stocks just search here.
If you're looking to trade Shanghai Jahwa United, open an account with the lowest-cost platform trusted by professionals, Interactive Brokers.
With clients in over 200 countries and territories, and access to 160 markets, IBKR lets you trade stocks, options, futures, forex, bonds and funds from a single integrated account.
Enjoy no hidden fees, no account minimums, and FX conversion rates as low as 0.03%, far better than what most brokers offer.
Sponsored ContentNew: Manage All Your Stock Portfolios in One Place
We've created the ultimate portfolio companion for stock investors, and it's free.
• Connect an unlimited number of Portfolios and see your total in one currency
• Be alerted to new Warning Signs or Risks via email or mobile
• Track the Fair Value of your stocks
Have feedback on this article? Concerned about the content? Get in touch with us directly. Alternatively, email editorial-team (at) simplywallst.com.
This article by Simply Wall St is general in nature. We provide commentary based on historical data and analyst forecasts only using an unbiased methodology and our articles are not intended to be financial advice. It does not constitute a recommendation to buy or sell any stock, and does not take account of your objectives, or your financial situation. We aim to bring you long-term focused analysis driven by fundamental data. Note that our analysis may not factor in the latest price-sensitive company announcements or qualitative material. Simply Wall St has no position in any stocks mentioned.
Have feedback on this article? Concerned about the content? Get in touch with us directly. Alternatively, email editorial-team@simplywallst.com
About SHSE:600315
Shanghai Jahwa United
Engages in the research and development, production, and sale of skin care, personal care, home cleaning, maternal, and child products in the People’s Republic of China and internationally.
Excellent balance sheet with moderate growth potential.
Similar Companies
Market Insights

Community Narratives


