- China
- /
- Medical Equipment
- /
- SZSE:301371
Is Harbin Fuerjia Technology Co., Ltd. (SZSE:301371) Expensive For A Reason? A Look At Its Intrinsic Value

Key Insights
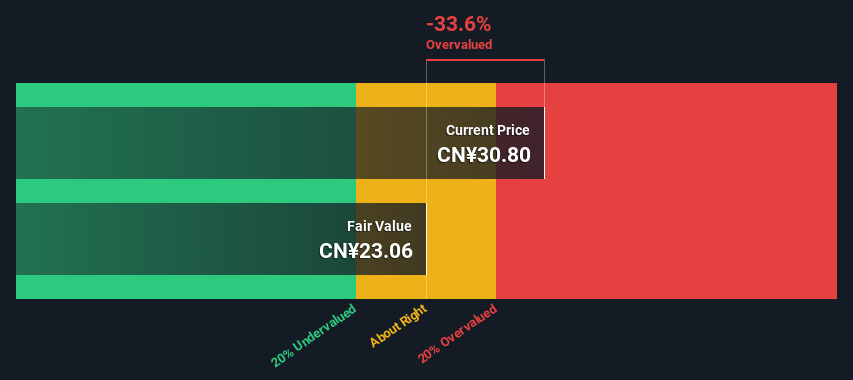
- Harbin Fuerjia Technology's estimated fair value is CN¥23.06 based on 2 Stage Free Cash Flow to Equity
- Current share price of CN¥30.80 suggests Harbin Fuerjia Technology is potentially 34% overvalued
- The CN¥51.50 analyst price target for 301371 is 123% more than our estimate of fair value
How far off is Harbin Fuerjia Technology Co., Ltd. (SZSE:301371) from its intrinsic value? Using the most recent financial data, we'll take a look at whether the stock is fairly priced by projecting its future cash flows and then discounting them to today's value. The Discounted Cash Flow (DCF) model is the tool we will apply to do this. Before you think you won't be able to understand it, just read on! It's actually much less complex than you'd imagine.
We generally believe that a company's value is the present value of all of the cash it will generate in the future. However, a DCF is just one valuation metric among many, and it is not without flaws. If you still have some burning questions about this type of valuation, take a look at the Simply Wall St analysis model.
View our latest analysis for Harbin Fuerjia Technology
The Method
We are going to use a two-stage DCF model, which, as the name states, takes into account two stages of growth. The first stage is generally a higher growth period which levels off heading towards the terminal value, captured in the second 'steady growth' period. To start off with, we need to estimate the next ten years of cash flows. Seeing as no analyst estimates of free cash flow are available to us, we have extrapolate the previous free cash flow (FCF) from the company's last reported value. We assume companies with shrinking free cash flow will slow their rate of shrinkage, and that companies with growing free cash flow will see their growth rate slow, over this period. We do this to reflect that growth tends to slow more in the early years than it does in later years.
Generally we assume that a dollar today is more valuable than a dollar in the future, so we discount the value of these future cash flows to their estimated value in today's dollars:
10-year free cash flow (FCF) forecast
| 2024 | 2025 | 2026 | 2027 | 2028 | 2029 | 2030 | 2031 | 2032 | 2033 | |
| Levered FCF (CN¥, Millions) | CN¥476.9m | CN¥471.3m | CN¥471.6m | CN¥476.0m | CN¥483.3m | CN¥492.7m | CN¥503.8m | CN¥516.2m | CN¥529.6m | CN¥543.9m |
| Growth Rate Estimate Source | Est @ -2.93% | Est @ -1.17% | Est @ 0.06% | Est @ 0.93% | Est @ 1.53% | Est @ 1.95% | Est @ 2.25% | Est @ 2.46% | Est @ 2.60% | Est @ 2.70% |
| Present Value (CN¥, Millions) Discounted @ 8.1% | CN¥441 | CN¥404 | CN¥374 | CN¥349 | CN¥328 | CN¥309 | CN¥293 | CN¥277 | CN¥263 | CN¥250 |
("Est" = FCF growth rate estimated by Simply Wall St)
Present Value of 10-year Cash Flow (PVCF) = CN¥3.3b
After calculating the present value of future cash flows in the initial 10-year period, we need to calculate the Terminal Value, which accounts for all future cash flows beyond the first stage. The Gordon Growth formula is used to calculate Terminal Value at a future annual growth rate equal to the 5-year average of the 10-year government bond yield of 2.9%. We discount the terminal cash flows to today's value at a cost of equity of 8.1%.
Terminal Value (TV)= FCF2033 × (1 + g) ÷ (r – g) = CN¥544m× (1 + 2.9%) ÷ (8.1%– 2.9%) = CN¥11b
Present Value of Terminal Value (PVTV)= TV / (1 + r)10= CN¥11b÷ ( 1 + 8.1%)10= CN¥5.0b
The total value, or equity value, is then the sum of the present value of the future cash flows, which in this case is CN¥8.3b. To get the intrinsic value per share, we divide this by the total number of shares outstanding. Relative to the current share price of CN¥30.8, the company appears potentially overvalued at the time of writing. The assumptions in any calculation have a big impact on the valuation, so it is better to view this as a rough estimate, not precise down to the last cent.
Important Assumptions
We would point out that the most important inputs to a discounted cash flow are the discount rate and of course the actual cash flows. If you don't agree with these result, have a go at the calculation yourself and play with the assumptions. The DCF also does not consider the possible cyclicality of an industry, or a company's future capital requirements, so it does not give a full picture of a company's potential performance. Given that we are looking at Harbin Fuerjia Technology as potential shareholders, the cost of equity is used as the discount rate, rather than the cost of capital (or weighted average cost of capital, WACC) which accounts for debt. In this calculation we've used 8.1%, which is based on a levered beta of 0.912. Beta is a measure of a stock's volatility, compared to the market as a whole. We get our beta from the industry average beta of globally comparable companies, with an imposed limit between 0.8 and 2.0, which is a reasonable range for a stable business.
SWOT Analysis for Harbin Fuerjia Technology
- Currently debt free.
- Earnings declined over the past year.
- Annual earnings are forecast to grow for the next 3 years.
- Good value based on P/E ratio compared to estimated Fair P/E ratio.
- Annual earnings are forecast to grow slower than the Chinese market.
Moving On:
Whilst important, the DCF calculation ideally won't be the sole piece of analysis you scrutinize for a company. It's not possible to obtain a foolproof valuation with a DCF model. Rather it should be seen as a guide to "what assumptions need to be true for this stock to be under/overvalued?" For example, changes in the company's cost of equity or the risk free rate can significantly impact the valuation. Why is the intrinsic value lower than the current share price? For Harbin Fuerjia Technology, we've compiled three fundamental aspects you should consider:
- Financial Health: Does 301371 have a healthy balance sheet? Take a look at our free balance sheet analysis with six simple checks on key factors like leverage and risk.
- Future Earnings: How does 301371's growth rate compare to its peers and the wider market? Dig deeper into the analyst consensus number for the upcoming years by interacting with our free analyst growth expectation chart.
- Other High Quality Alternatives: Do you like a good all-rounder? Explore our interactive list of high quality stocks to get an idea of what else is out there you may be missing!
PS. The Simply Wall St app conducts a discounted cash flow valuation for every stock on the SZSE every day. If you want to find the calculation for other stocks just search here.
Valuation is complex, but we're here to simplify it.
Discover if Harbin Fuerjia Technology might be undervalued or overvalued with our detailed analysis, featuring fair value estimates, potential risks, dividends, insider trades, and its financial condition.
Access Free AnalysisHave feedback on this article? Concerned about the content? Get in touch with us directly. Alternatively, email editorial-team (at) simplywallst.com.
This article by Simply Wall St is general in nature. We provide commentary based on historical data and analyst forecasts only using an unbiased methodology and our articles are not intended to be financial advice. It does not constitute a recommendation to buy or sell any stock, and does not take account of your objectives, or your financial situation. We aim to bring you long-term focused analysis driven by fundamental data. Note that our analysis may not factor in the latest price-sensitive company announcements or qualitative material. Simply Wall St has no position in any stocks mentioned.
About SZSE:301371
Harbin Fuerjia Technology
Engages in the research, development, production, and sale of skin care products in China.
Flawless balance sheet, good value and pays a dividend.
Market Insights

Community Narratives
