
Advertisement
- China
- /
- Healthcare Services
- /
- SZSE:002219
Returns At New Journey Health Technology GroupLTD (SZSE:002219) Are On The Way Up

To find a multi-bagger stock, what are the underlying trends we should look for in a business? Amongst other things, we'll want to see two things; firstly, a growing return on capital employed (ROCE) and secondly, an expansion in the company's amount of capital employed. This shows us that it's a compounding machine, able to continually reinvest its earnings back into the business and generate higher returns. So on that note, New Journey Health Technology GroupLTD (SZSE:002219) looks quite promising in regards to its trends of return on capital.
Return On Capital Employed (ROCE): What Is It?
Just to clarify if you're unsure, ROCE is a metric for evaluating how much pre-tax income (in percentage terms) a company earns on the capital invested in its business. To calculate this metric for New Journey Health Technology GroupLTD, this is the formula:
Return on Capital Employed = Earnings Before Interest and Tax (EBIT) ÷ (Total Assets - Current Liabilities)
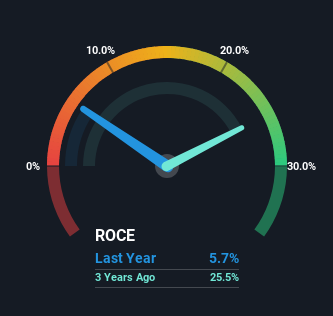
0.057 = CN¥182m ÷ (CN¥6.2b - CN¥3.0b) (Based on the trailing twelve months to March 2024).
Thus, New Journey Health Technology GroupLTD has an ROCE of 5.7%. Ultimately, that's a low return and it under-performs the Healthcare industry average of 9.5%.
Check out our latest analysis for New Journey Health Technology GroupLTD
While the past is not representative of the future, it can be helpful to know how a company has performed historically, which is why we have this chart above. If you're interested in investigating New Journey Health Technology GroupLTD's past further, check out this free graph covering New Journey Health Technology GroupLTD's past earnings, revenue and cash flow.
What Does the ROCE Trend For New Journey Health Technology GroupLTD Tell Us?
It's great to see that New Journey Health Technology GroupLTD has started to generate some pre-tax earnings from prior investments. While the business is profitable now, it used to be incurring losses on invested capital five years ago. Additionally, the business is utilizing 45% less capital than it was five years ago, and taken at face value, that can mean the company needs less funds at work to get a return. This could potentially mean that the company is selling some of its assets.
On a side note, we noticed that the improvement in ROCE appears to be partly fueled by an increase in current liabilities. Essentially the business now has suppliers or short-term creditors funding about 49% of its operations, which isn't ideal. Given it's pretty high ratio, we'd remind investors that having current liabilities at those levels can bring about some risks in certain businesses.
Our Take On New Journey Health Technology GroupLTD's ROCE
In the end, New Journey Health Technology GroupLTD has proven it's capital allocation skills are good with those higher returns from less amount of capital. And since the stock has fallen 34% over the last five years, there might be an opportunity here. So researching this company further and determining whether or not these trends will continue seems justified.
New Journey Health Technology GroupLTD does have some risks, we noticed 3 warning signs (and 1 which is a bit concerning) we think you should know about.
For those who like to invest in solid companies, check out this free list of companies with solid balance sheets and high returns on equity.
Valuation is complex, but we're here to simplify it.
Discover if New Journey Health Technology GroupLTD might be undervalued or overvalued with our detailed analysis, featuring fair value estimates, potential risks, dividends, insider trades, and its financial condition.
Access Free AnalysisHave feedback on this article? Concerned about the content? Get in touch with us directly. Alternatively, email editorial-team (at) simplywallst.com.
This article by Simply Wall St is general in nature. We provide commentary based on historical data and analyst forecasts only using an unbiased methodology and our articles are not intended to be financial advice. It does not constitute a recommendation to buy or sell any stock, and does not take account of your objectives, or your financial situation. We aim to bring you long-term focused analysis driven by fundamental data. Note that our analysis may not factor in the latest price-sensitive company announcements or qualitative material. Simply Wall St has no position in any stocks mentioned.
About SZSE:002219
New Journey Health Technology GroupLTD
Provides medical services and pharmaceuticals products in China and internationally.
Low with imperfect balance sheet.
Market Insights


Advertisement
Community Narratives
Nike's Direct-to-Consumer Focus Will Drive Future Growth
Fair Value US$87.90|18.2% undervalued
UN
Community Contributor
Novo Nordisk will dominate GLP-1 market with Ozempic and Wegovy growth
Fair Value US$89.59|12.1% undervalued
BE
Community Contributor
Rheinmetall could get 20-25% of EU-NATO 3%-GDP defence spending
Fair Value €7.57k|82.8% undervalued
NO
Community Contributor