- China
- /
- Medical Equipment
- /
- SHSE:688607
Even With A 36% Surge, Cautious Investors Are Not Rewarding CareRay Digital Medical Technology Co., Ltd.'s (SHSE:688607) Performance Completely


Those holding CareRay Digital Medical Technology Co., Ltd. (SHSE:688607) shares would be relieved that the share price has rebounded 36% in the last thirty days, but it needs to keep going to repair the recent damage it has caused to investor portfolios. Unfortunately, the gains of the last month did little to right the losses of the last year with the stock still down 44% over that time.
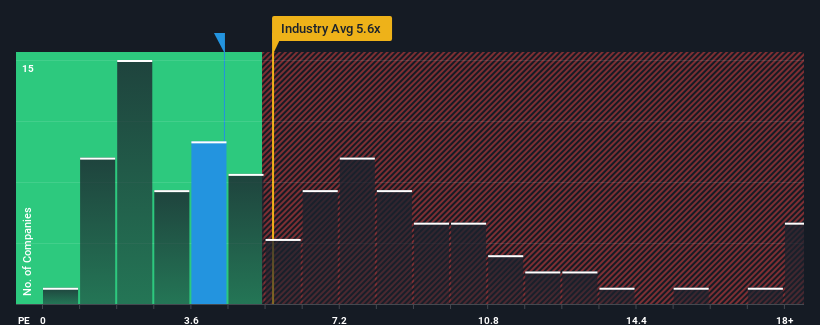
Even after such a large jump in price, CareRay Digital Medical Technology's price-to-sales (or "P/S") ratio of 4.4x might still make it look like a buy right now compared to the Medical Equipment industry in China, where around half of the companies have P/S ratios above 5.6x and even P/S above 9x are quite common. Although, it's not wise to just take the P/S at face value as there may be an explanation why it's limited.
Check out our latest analysis for CareRay Digital Medical Technology
What Does CareRay Digital Medical Technology's Recent Performance Look Like?
CareRay Digital Medical Technology certainly has been doing a good job lately as it's been growing revenue more than most other companies. One possibility is that the P/S ratio is low because investors think this strong revenue performance might be less impressive moving forward. If the company manages to stay the course, then investors should be rewarded with a share price that matches its revenue figures.
Want the full picture on analyst estimates for the company? Then our free report on CareRay Digital Medical Technology will help you uncover what's on the horizon.How Is CareRay Digital Medical Technology's Revenue Growth Trending?
There's an inherent assumption that a company should underperform the industry for P/S ratios like CareRay Digital Medical Technology's to be considered reasonable.
Retrospectively, the last year delivered an exceptional 33% gain to the company's top line. Still, revenue has fallen 20% in total from three years ago, which is quite disappointing. Accordingly, shareholders would have felt downbeat about the medium-term rates of revenue growth.
Looking ahead now, revenue is anticipated to climb by 40% during the coming year according to the lone analyst following the company. With the industry only predicted to deliver 26%, the company is positioned for a stronger revenue result.
With this in consideration, we find it intriguing that CareRay Digital Medical Technology's P/S sits behind most of its industry peers. It looks like most investors are not convinced at all that the company can achieve future growth expectations.
What Does CareRay Digital Medical Technology's P/S Mean For Investors?
The latest share price surge wasn't enough to lift CareRay Digital Medical Technology's P/S close to the industry median. Using the price-to-sales ratio alone to determine if you should sell your stock isn't sensible, however it can be a practical guide to the company's future prospects.
A look at CareRay Digital Medical Technology's revenues reveals that, despite glowing future growth forecasts, its P/S is much lower than we'd expect. The reason for this depressed P/S could potentially be found in the risks the market is pricing in. While the possibility of the share price plunging seems unlikely due to the high growth forecasted for the company, the market does appear to have some hesitation.
There are also other vital risk factors to consider before investing and we've discovered 1 warning sign for CareRay Digital Medical Technology that you should be aware of.
If these risks are making you reconsider your opinion on CareRay Digital Medical Technology, explore our interactive list of high quality stocks to get an idea of what else is out there.
If you're looking to trade CareRay Digital Medical Technology, open an account with the lowest-cost platform trusted by professionals, Interactive Brokers.
With clients in over 200 countries and territories, and access to 160 markets, IBKR lets you trade stocks, options, futures, forex, bonds and funds from a single integrated account.
Enjoy no hidden fees, no account minimums, and FX conversion rates as low as 0.03%, far better than what most brokers offer.
Sponsored ContentNew: AI Stock Screener & Alerts
Our new AI Stock Screener scans the market every day to uncover opportunities.
• Dividend Powerhouses (3%+ Yield)
• Undervalued Small Caps with Insider Buying
• High growth Tech and AI Companies
Or build your own from over 50 metrics.
Have feedback on this article? Concerned about the content? Get in touch with us directly. Alternatively, email editorial-team (at) simplywallst.com.
This article by Simply Wall St is general in nature. We provide commentary based on historical data and analyst forecasts only using an unbiased methodology and our articles are not intended to be financial advice. It does not constitute a recommendation to buy or sell any stock, and does not take account of your objectives, or your financial situation. We aim to bring you long-term focused analysis driven by fundamental data. Note that our analysis may not factor in the latest price-sensitive company announcements or qualitative material. Simply Wall St has no position in any stocks mentioned.
About SHSE:688607
CareRay Digital Medical Technology
CareRay Digital Medical Technology Co., Ltd.
Flawless balance sheet with high growth potential.
Market Insights

Community Narratives

