- China
- /
- Medical Equipment
- /
- SHSE:688050
Eyebright Medical Technology (Beijing) Co., Ltd. (SHSE:688050) May Have Run Too Fast Too Soon With Recent 26% Price Plummet


To the annoyance of some shareholders, Eyebright Medical Technology (Beijing) Co., Ltd. (SHSE:688050) shares are down a considerable 26% in the last month, which continues a horrid run for the company. The drop over the last 30 days has capped off a tough year for shareholders, with the share price down 38% in that time.
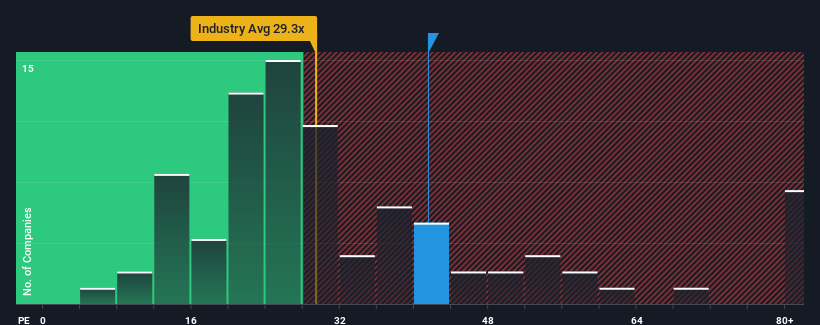
Even after such a large drop in price, Eyebright Medical Technology (Beijing) may still be sending bearish signals at the moment with its price-to-earnings (or "P/E") ratio of 41.5x, since almost half of all companies in China have P/E ratios under 31x and even P/E's lower than 18x are not unusual. Nonetheless, we'd need to dig a little deeper to determine if there is a rational basis for the elevated P/E.
Recent times have been advantageous for Eyebright Medical Technology (Beijing) as its earnings have been rising faster than most other companies. It seems that many are expecting the strong earnings performance to persist, which has raised the P/E. You'd really hope so, otherwise you're paying a pretty hefty price for no particular reason.
View our latest analysis for Eyebright Medical Technology (Beijing)
How Is Eyebright Medical Technology (Beijing)'s Growth Trending?
In order to justify its P/E ratio, Eyebright Medical Technology (Beijing) would need to produce impressive growth in excess of the market.
Taking a look back first, we see that the company grew earnings per share by an impressive 31% last year. The strong recent performance means it was also able to grow EPS by 168% in total over the last three years. So we can start by confirming that the company has done a great job of growing earnings over that time.
Looking ahead now, EPS is anticipated to climb by 26% during the coming year according to the five analysts following the company. That's shaping up to be materially lower than the 39% growth forecast for the broader market.
With this information, we find it concerning that Eyebright Medical Technology (Beijing) is trading at a P/E higher than the market. It seems most investors are hoping for a turnaround in the company's business prospects, but the analyst cohort is not so confident this will happen. There's a good chance these shareholders are setting themselves up for future disappointment if the P/E falls to levels more in line with the growth outlook.
The Bottom Line On Eyebright Medical Technology (Beijing)'s P/E
Eyebright Medical Technology (Beijing)'s P/E hasn't come down all the way after its stock plunged. Typically, we'd caution against reading too much into price-to-earnings ratios when settling on investment decisions, though it can reveal plenty about what other market participants think about the company.
We've established that Eyebright Medical Technology (Beijing) currently trades on a much higher than expected P/E since its forecast growth is lower than the wider market. When we see a weak earnings outlook with slower than market growth, we suspect the share price is at risk of declining, sending the high P/E lower. Unless these conditions improve markedly, it's very challenging to accept these prices as being reasonable.
A lot of potential risks can sit within a company's balance sheet. You can assess many of the main risks through our free balance sheet analysis for Eyebright Medical Technology (Beijing) with six simple checks.
If these risks are making you reconsider your opinion on Eyebright Medical Technology (Beijing), explore our interactive list of high quality stocks to get an idea of what else is out there.
Valuation is complex, but we're here to simplify it.
Discover if Eyebright Medical Technology (Beijing) might be undervalued or overvalued with our detailed analysis, featuring fair value estimates, potential risks, dividends, insider trades, and its financial condition.
Access Free AnalysisHave feedback on this article? Concerned about the content? Get in touch with us directly. Alternatively, email editorial-team (at) simplywallst.com.
This article by Simply Wall St is general in nature. We provide commentary based on historical data and analyst forecasts only using an unbiased methodology and our articles are not intended to be financial advice. It does not constitute a recommendation to buy or sell any stock, and does not take account of your objectives, or your financial situation. We aim to bring you long-term focused analysis driven by fundamental data. Note that our analysis may not factor in the latest price-sensitive company announcements or qualitative material. Simply Wall St has no position in any stocks mentioned.
About SHSE:688050
Eyebright Medical Technology (Beijing)
Eyebright Medical Technology (Beijing) Co., Ltd.
High growth potential with excellent balance sheet.
Similar Companies
Market Insights

Community Narratives

