- China
- /
- Healthcare Services
- /
- SHSE:600211
Under The Bonnet, Tibet Rhodiola Pharmaceutical Holding's (SHSE:600211) Returns Look Impressive


Did you know there are some financial metrics that can provide clues of a potential multi-bagger? Firstly, we'll want to see a proven return on capital employed (ROCE) that is increasing, and secondly, an expanding base of capital employed. This shows us that it's a compounding machine, able to continually reinvest its earnings back into the business and generate higher returns. Speaking of which, we noticed some great changes in Tibet Rhodiola Pharmaceutical Holding's (SHSE:600211) returns on capital, so let's have a look.
Understanding Return On Capital Employed (ROCE)
For those who don't know, ROCE is a measure of a company's yearly pre-tax profit (its return), relative to the capital employed in the business. The formula for this calculation on Tibet Rhodiola Pharmaceutical Holding is:
Return on Capital Employed = Earnings Before Interest and Tax (EBIT) ÷ (Total Assets - Current Liabilities)
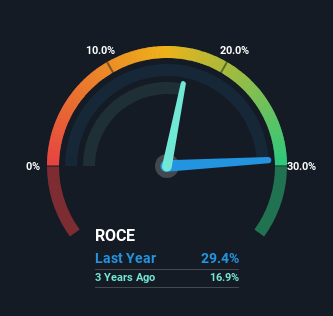
0.29 = CN¥1.0b ÷ (CN¥4.7b - CN¥1.2b) (Based on the trailing twelve months to September 2023).
Therefore, Tibet Rhodiola Pharmaceutical Holding has an ROCE of 29%. That's a fantastic return and not only that, it outpaces the average of 11% earned by companies in a similar industry.
See our latest analysis for Tibet Rhodiola Pharmaceutical Holding
In the above chart we have measured Tibet Rhodiola Pharmaceutical Holding's prior ROCE against its prior performance, but the future is arguably more important. If you'd like to see what analysts are forecasting going forward, you should check out our free analyst report for Tibet Rhodiola Pharmaceutical Holding .
What Does the ROCE Trend For Tibet Rhodiola Pharmaceutical Holding Tell Us?
The trends we've noticed at Tibet Rhodiola Pharmaceutical Holding are quite reassuring. Over the last five years, returns on capital employed have risen substantially to 29%. Basically the business is earning more per dollar of capital invested and in addition to that, 52% more capital is being employed now too. So we're very much inspired by what we're seeing at Tibet Rhodiola Pharmaceutical Holding thanks to its ability to profitably reinvest capital.
For the record though, there was a noticeable increase in the company's current liabilities over the period, so we would attribute some of the ROCE growth to that. The current liabilities has increased to 26% of total assets, so the business is now more funded by the likes of its suppliers or short-term creditors. It's worth keeping an eye on this because as the percentage of current liabilities to total assets increases, some aspects of risk also increase.
What We Can Learn From Tibet Rhodiola Pharmaceutical Holding's ROCE
A company that is growing its returns on capital and can consistently reinvest in itself is a highly sought after trait, and that's what Tibet Rhodiola Pharmaceutical Holding has. Since the stock has returned a solid 67% to shareholders over the last five years, it's fair to say investors are beginning to recognize these changes. With that being said, we still think the promising fundamentals mean the company deserves some further due diligence.
If you want to continue researching Tibet Rhodiola Pharmaceutical Holding, you might be interested to know about the 1 warning sign that our analysis has discovered.
If you want to search for more stocks that have been earning high returns, check out this free list of stocks with solid balance sheets that are also earning high returns on equity.
If you're looking to trade Tibet Rhodiola Pharmaceutical Holding, open an account with the lowest-cost platform trusted by professionals, Interactive Brokers.
With clients in over 200 countries and territories, and access to 160 markets, IBKR lets you trade stocks, options, futures, forex, bonds and funds from a single integrated account.
Enjoy no hidden fees, no account minimums, and FX conversion rates as low as 0.03%, far better than what most brokers offer.
Sponsored ContentValuation is complex, but we're here to simplify it.
Discover if Tibet Rhodiola Pharmaceutical Holding might be undervalued or overvalued with our detailed analysis, featuring fair value estimates, potential risks, dividends, insider trades, and its financial condition.
Access Free AnalysisHave feedback on this article? Concerned about the content? Get in touch with us directly. Alternatively, email editorial-team (at) simplywallst.com.
This article by Simply Wall St is general in nature. We provide commentary based on historical data and analyst forecasts only using an unbiased methodology and our articles are not intended to be financial advice. It does not constitute a recommendation to buy or sell any stock, and does not take account of your objectives, or your financial situation. We aim to bring you long-term focused analysis driven by fundamental data. Note that our analysis may not factor in the latest price-sensitive company announcements or qualitative material. Simply Wall St has no position in any stocks mentioned.
About SHSE:600211
Tibet Rhodiola Pharmaceutical Holding
Tibet Rhodiola Pharmaceutical Holding Co.
Undervalued with solid track record and pays a dividend.

