Royal Group Co.,Ltd.'s (SZSE:002329) 30% Dip In Price Shows Sentiment Is Matching Revenues


The Royal Group Co.,Ltd. (SZSE:002329) share price has fared very poorly over the last month, falling by a substantial 30%. The drop over the last 30 days has capped off a tough year for shareholders, with the share price down 46% in that time.
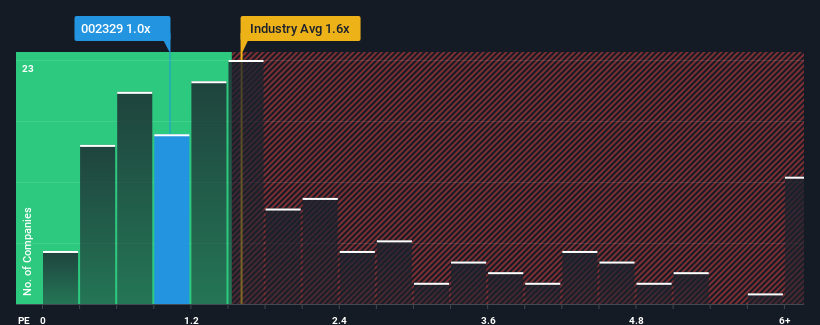
Even after such a large drop in price, Royal GroupLtd's price-to-sales (or "P/S") ratio of 1x might still make it look like a buy right now compared to the Food industry in China, where around half of the companies have P/S ratios above 1.6x and even P/S above 4x are quite common. However, the P/S might be low for a reason and it requires further investigation to determine if it's justified.
Check out our latest analysis for Royal GroupLtd
How Has Royal GroupLtd Performed Recently?
For example, consider that Royal GroupLtd's financial performance has been poor lately as its revenue has been in decline. One possibility is that the P/S is low because investors think the company won't do enough to avoid underperforming the broader industry in the near future. If you like the company, you'd be hoping this isn't the case so that you could potentially pick up some stock while it's out of favour.
We don't have analyst forecasts, but you can see how recent trends are setting up the company for the future by checking out our free report on Royal GroupLtd's earnings, revenue and cash flow.Is There Any Revenue Growth Forecasted For Royal GroupLtd?
The only time you'd be truly comfortable seeing a P/S as low as Royal GroupLtd's is when the company's growth is on track to lag the industry.
Retrospectively, the last year delivered a frustrating 19% decrease to the company's top line. The last three years don't look nice either as the company has shrunk revenue by 7.0% in aggregate. Accordingly, shareholders would have felt downbeat about the medium-term rates of revenue growth.
In contrast to the company, the rest of the industry is expected to grow by 18% over the next year, which really puts the company's recent medium-term revenue decline into perspective.
With this information, we are not surprised that Royal GroupLtd is trading at a P/S lower than the industry. However, we think shrinking revenues are unlikely to lead to a stable P/S over the longer term, which could set up shareholders for future disappointment. There's potential for the P/S to fall to even lower levels if the company doesn't improve its top-line growth.
The Final Word
Royal GroupLtd's recently weak share price has pulled its P/S back below other Food companies. We'd say the price-to-sales ratio's power isn't primarily as a valuation instrument but rather to gauge current investor sentiment and future expectations.
As we suspected, our examination of Royal GroupLtd revealed its shrinking revenue over the medium-term is contributing to its low P/S, given the industry is set to grow. At this stage investors feel the potential for an improvement in revenue isn't great enough to justify a higher P/S ratio. If recent medium-term revenue trends continue, it's hard to see the share price moving strongly in either direction in the near future under these circumstances.
Before you settle on your opinion, we've discovered 2 warning signs for Royal GroupLtd (1 is concerning!) that you should be aware of.
If these risks are making you reconsider your opinion on Royal GroupLtd, explore our interactive list of high quality stocks to get an idea of what else is out there.
If you're looking to trade Royal GroupLtd, open an account with the lowest-cost platform trusted by professionals, Interactive Brokers.
With clients in over 200 countries and territories, and access to 160 markets, IBKR lets you trade stocks, options, futures, forex, bonds and funds from a single integrated account.
Enjoy no hidden fees, no account minimums, and FX conversion rates as low as 0.03%, far better than what most brokers offer.
Sponsored ContentNew: AI Stock Screener & Alerts
Our new AI Stock Screener scans the market every day to uncover opportunities.
• Dividend Powerhouses (3%+ Yield)
• Undervalued Small Caps with Insider Buying
• High growth Tech and AI Companies
Or build your own from over 50 metrics.
Have feedback on this article? Concerned about the content? Get in touch with us directly. Alternatively, email editorial-team (at) simplywallst.com.
This article by Simply Wall St is general in nature. We provide commentary based on historical data and analyst forecasts only using an unbiased methodology and our articles are not intended to be financial advice. It does not constitute a recommendation to buy or sell any stock, and does not take account of your objectives, or your financial situation. We aim to bring you long-term focused analysis driven by fundamental data. Note that our analysis may not factor in the latest price-sensitive company announcements or qualitative material. Simply Wall St has no position in any stocks mentioned.
About SZSE:002329
Royal GroupLtd
Engages in the processing, producing, and selling dairy products in China.
Good value with mediocre balance sheet.
Market Insights

Community Narratives

