- China
- /
- Energy Services
- /
- SZSE:300471
A Look At The Fair Value Of Houpu Clean Energy Group Co., Ltd. (SZSE:300471)


Key Insights
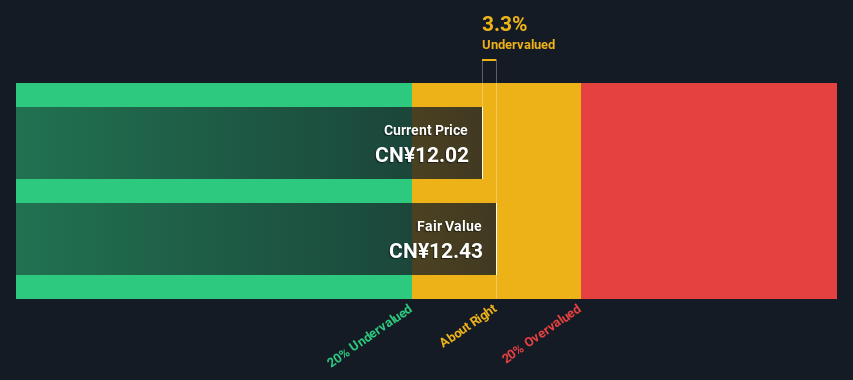
- Houpu Clean Energy Group's estimated fair value is CN¥12.43 based on 2 Stage Free Cash Flow to Equity
- With CN¥12.02 share price, Houpu Clean Energy Group appears to be trading close to its estimated fair value
- Houpu Clean Energy Group's peers are currently trading at a premium of 792% on average
How far off is Houpu Clean Energy Group Co., Ltd. (SZSE:300471) from its intrinsic value? Using the most recent financial data, we'll take a look at whether the stock is fairly priced by projecting its future cash flows and then discounting them to today's value. We will take advantage of the Discounted Cash Flow (DCF) model for this purpose. Believe it or not, it's not too difficult to follow, as you'll see from our example!
Companies can be valued in a lot of ways, so we would point out that a DCF is not perfect for every situation. If you want to learn more about discounted cash flow, the rationale behind this calculation can be read in detail in the Simply Wall St analysis model.
View our latest analysis for Houpu Clean Energy Group
Crunching The Numbers
We are going to use a two-stage DCF model, which, as the name states, takes into account two stages of growth. The first stage is generally a higher growth period which levels off heading towards the terminal value, captured in the second 'steady growth' period. To start off with, we need to estimate the next ten years of cash flows. Seeing as no analyst estimates of free cash flow are available to us, we have extrapolate the previous free cash flow (FCF) from the company's last reported value. We assume companies with shrinking free cash flow will slow their rate of shrinkage, and that companies with growing free cash flow will see their growth rate slow, over this period. We do this to reflect that growth tends to slow more in the early years than it does in later years.
A DCF is all about the idea that a dollar in the future is less valuable than a dollar today, and so the sum of these future cash flows is then discounted to today's value:
10-year free cash flow (FCF) estimate
| 2024 | 2025 | 2026 | 2027 | 2028 | 2029 | 2030 | 2031 | 2032 | 2033 | |
| Levered FCF (CN¥, Millions) | CN¥132.3m | CN¥194.4m | CN¥260.1m | CN¥324.0m | CN¥382.5m | CN¥434.2m | CN¥479.1m | CN¥518.1m | CN¥552.1m | CN¥582.3m |
| Growth Rate Estimate Source | Est @ 65.91% | Est @ 47.02% | Est @ 33.79% | Est @ 24.54% | Est @ 18.06% | Est @ 13.52% | Est @ 10.35% | Est @ 8.13% | Est @ 6.57% | Est @ 5.48% |
| Present Value (CN¥, Millions) Discounted @ 10% | CN¥120 | CN¥159 | CN¥193 | CN¥218 | CN¥233 | CN¥239 | CN¥239 | CN¥234 | CN¥226 | CN¥215 |
("Est" = FCF growth rate estimated by Simply Wall St)
Present Value of 10-year Cash Flow (PVCF) = CN¥2.1b
The second stage is also known as Terminal Value, this is the business's cash flow after the first stage. For a number of reasons a very conservative growth rate is used that cannot exceed that of a country's GDP growth. In this case we have used the 5-year average of the 10-year government bond yield (2.9%) to estimate future growth. In the same way as with the 10-year 'growth' period, we discount future cash flows to today's value, using a cost of equity of 10%.
Terminal Value (TV)= FCF2033 × (1 + g) ÷ (r – g) = CN¥582m× (1 + 2.9%) ÷ (10%– 2.9%) = CN¥8.0b
Present Value of Terminal Value (PVTV)= TV / (1 + r)10= CN¥8.0b÷ ( 1 + 10%)10= CN¥2.9b
The total value, or equity value, is then the sum of the present value of the future cash flows, which in this case is CN¥5.0b. To get the intrinsic value per share, we divide this by the total number of shares outstanding. Relative to the current share price of CN¥12.0, the company appears about fair value at a 3.3% discount to where the stock price trades currently. The assumptions in any calculation have a big impact on the valuation, so it is better to view this as a rough estimate, not precise down to the last cent.
Important Assumptions
The calculation above is very dependent on two assumptions. The first is the discount rate and the other is the cash flows. You don't have to agree with these inputs, I recommend redoing the calculations yourself and playing with them. The DCF also does not consider the possible cyclicality of an industry, or a company's future capital requirements, so it does not give a full picture of a company's potential performance. Given that we are looking at Houpu Clean Energy Group as potential shareholders, the cost of equity is used as the discount rate, rather than the cost of capital (or weighted average cost of capital, WACC) which accounts for debt. In this calculation we've used 10%, which is based on a levered beta of 1.335. Beta is a measure of a stock's volatility, compared to the market as a whole. We get our beta from the industry average beta of globally comparable companies, with an imposed limit between 0.8 and 2.0, which is a reasonable range for a stable business.
SWOT Analysis for Houpu Clean Energy Group
- Debt is not viewed as a risk.
- Shareholders have been diluted in the past year.
- Has sufficient cash runway for more than 3 years based on current free cash flows.
- Current share price is below our estimate of fair value.
- Lack of analyst coverage makes it difficult to determine 300471's earnings prospects.
- No apparent threats visible for 300471.
Next Steps:
Valuation is only one side of the coin in terms of building your investment thesis, and it is only one of many factors that you need to assess for a company. The DCF model is not a perfect stock valuation tool. Instead the best use for a DCF model is to test certain assumptions and theories to see if they would lead to the company being undervalued or overvalued. For example, changes in the company's cost of equity or the risk free rate can significantly impact the valuation. For Houpu Clean Energy Group, we've put together three relevant factors you should assess:
- Risks: For example, we've discovered 2 warning signs for Houpu Clean Energy Group that you should be aware of before investing here.
- Other High Quality Alternatives: Do you like a good all-rounder? Explore our interactive list of high quality stocks to get an idea of what else is out there you may be missing!
- Other Environmentally-Friendly Companies: Concerned about the environment and think consumers will buy eco-friendly products more and more? Browse through our interactive list of companies that are thinking about a greener future to discover some stocks you may not have thought of!
PS. Simply Wall St updates its DCF calculation for every Chinese stock every day, so if you want to find the intrinsic value of any other stock just search here.
Valuation is complex, but we're here to simplify it.
Discover if Houpu Clean Energy Group might be undervalued or overvalued with our detailed analysis, featuring fair value estimates, potential risks, dividends, insider trades, and its financial condition.
Access Free AnalysisHave feedback on this article? Concerned about the content? Get in touch with us directly. Alternatively, email editorial-team (at) simplywallst.com.
This article by Simply Wall St is general in nature. We provide commentary based on historical data and analyst forecasts only using an unbiased methodology and our articles are not intended to be financial advice. It does not constitute a recommendation to buy or sell any stock, and does not take account of your objectives, or your financial situation. We aim to bring you long-term focused analysis driven by fundamental data. Note that our analysis may not factor in the latest price-sensitive company announcements or qualitative material. Simply Wall St has no position in any stocks mentioned.
About SZSE:300471
Excellent balance sheet with weak fundamentals.
Similar Companies
Market Insights

Community Narratives

