- China
- /
- Energy Services
- /
- SZSE:002278
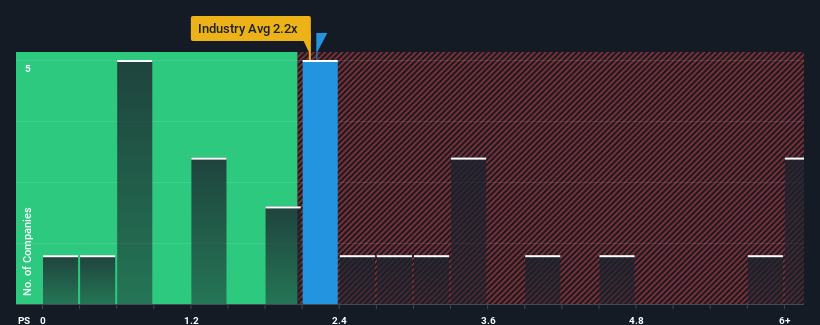
Some Shareholders Feeling Restless Over Shanghai SK Petroleum & Chemical Equipment Corporation Ltd.'s (SZSE:002278) P/S Ratio


It's not a stretch to say that Shanghai SK Petroleum & Chemical Equipment Corporation Ltd.'s (SZSE:002278) price-to-sales (or "P/S") ratio of 2.2x seems quite "middle-of-the-road" for Energy Services companies in China, seeing as it matches the P/S ratio of the wider industry. While this might not raise any eyebrows, if the P/S ratio is not justified investors could be missing out on a potential opportunity or ignoring looming disappointment.
View our latest analysis for Shanghai SK Petroleum & Chemical Equipment
How Has Shanghai SK Petroleum & Chemical Equipment Performed Recently?
The recent revenue growth at Shanghai SK Petroleum & Chemical Equipment would have to be considered satisfactory if not spectacular. It might be that many expect the respectable revenue performance to only match most other companies over the coming period, which has kept the P/S from rising. If not, then at least existing shareholders probably aren't too pessimistic about the future direction of the share price.
We don't have analyst forecasts, but you can see how recent trends are setting up the company for the future by checking out our free report on Shanghai SK Petroleum & Chemical Equipment's earnings, revenue and cash flow.How Is Shanghai SK Petroleum & Chemical Equipment's Revenue Growth Trending?
There's an inherent assumption that a company should be matching the industry for P/S ratios like Shanghai SK Petroleum & Chemical Equipment's to be considered reasonable.
Taking a look back first, we see that the company managed to grow revenues by a handy 6.9% last year. However, this wasn't enough as the latest three year period has seen an unpleasant 3.5% overall drop in revenue. So unfortunately, we have to acknowledge that the company has not done a great job of growing revenue over that time.
Comparing that to the industry, which is predicted to deliver 18% growth in the next 12 months, the company's downward momentum based on recent medium-term revenue results is a sobering picture.
With this in mind, we find it worrying that Shanghai SK Petroleum & Chemical Equipment's P/S exceeds that of its industry peers. Apparently many investors in the company are way less bearish than recent times would indicate and aren't willing to let go of their stock right now. Only the boldest would assume these prices are sustainable as a continuation of recent revenue trends is likely to weigh on the share price eventually.
The Key Takeaway
Generally, our preference is to limit the use of the price-to-sales ratio to establishing what the market thinks about the overall health of a company.
We find it unexpected that Shanghai SK Petroleum & Chemical Equipment trades at a P/S ratio that is comparable to the rest of the industry, despite experiencing declining revenues during the medium-term, while the industry as a whole is expected to grow. When we see revenue heading backwards in the context of growing industry forecasts, it'd make sense to expect a possible share price decline on the horizon, sending the moderate P/S lower. If recent medium-term revenue trends continue, it will place shareholders' investments at risk and potential investors in danger of paying an unnecessary premium.
Plus, you should also learn about this 1 warning sign we've spotted with Shanghai SK Petroleum & Chemical Equipment.
If strong companies turning a profit tickle your fancy, then you'll want to check out this free list of interesting companies that trade on a low P/E (but have proven they can grow earnings).
New: Manage All Your Stock Portfolios in One Place
We've created the ultimate portfolio companion for stock investors, and it's free.
• Connect an unlimited number of Portfolios and see your total in one currency
• Be alerted to new Warning Signs or Risks via email or mobile
• Track the Fair Value of your stocks
Have feedback on this article? Concerned about the content? Get in touch with us directly. Alternatively, email editorial-team (at) simplywallst.com.
This article by Simply Wall St is general in nature. We provide commentary based on historical data and analyst forecasts only using an unbiased methodology and our articles are not intended to be financial advice. It does not constitute a recommendation to buy or sell any stock, and does not take account of your objectives, or your financial situation. We aim to bring you long-term focused analysis driven by fundamental data. Note that our analysis may not factor in the latest price-sensitive company announcements or qualitative material. Simply Wall St has no position in any stocks mentioned.
About SZSE:002278
Shanghai SK Petroleum & Chemical Equipment
Engages in the research and development, and manufacture of petroleum and chemical equipment in China.
Adequate balance sheet low.
Market Insights

Community Narratives
