- China
- /
- Oil and Gas
- /
- SHSE:600777
Take Care Before Jumping Onto Shandong Xinchao Energy Corporation Limited (SHSE:600777) Even Though It's 34% Cheaper


The Shandong Xinchao Energy Corporation Limited (SHSE:600777) share price has fared very poorly over the last month, falling by a substantial 34%. The drop over the last 30 days has capped off a tough year for shareholders, with the share price down 33% in that time.
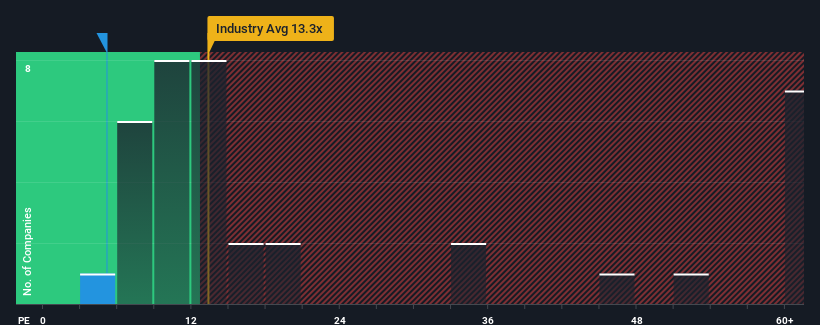
Although its price has dipped substantially, Shandong Xinchao Energy's price-to-earnings (or "P/E") ratio of 5.1x might still make it look like a strong buy right now compared to the market in China, where around half of the companies have P/E ratios above 33x and even P/E's above 63x are quite common. Nonetheless, we'd need to dig a little deeper to determine if there is a rational basis for the highly reduced P/E.
For instance, Shandong Xinchao Energy's receding earnings in recent times would have to be some food for thought. It might be that many expect the disappointing earnings performance to continue or accelerate, which has repressed the P/E. However, if this doesn't eventuate then existing shareholders may be feeling optimistic about the future direction of the share price.
See our latest analysis for Shandong Xinchao Energy
Is There Any Growth For Shandong Xinchao Energy?
Shandong Xinchao Energy's P/E ratio would be typical for a company that's expected to deliver very poor growth or even falling earnings, and importantly, perform much worse than the market.
Taking a look back first, the company's earnings per share growth last year wasn't something to get excited about as it posted a disappointing decline of 5.9%. However, a few very strong years before that means that it was still able to grow EPS by an impressive 1,279% in total over the last three years. Although it's been a bumpy ride, it's still fair to say the earnings growth recently has been more than adequate for the company.
Comparing that to the market, which is only predicted to deliver 38% growth in the next 12 months, the company's momentum is stronger based on recent medium-term annualised earnings results.
With this information, we find it odd that Shandong Xinchao Energy is trading at a P/E lower than the market. It looks like most investors are not convinced the company can maintain its recent growth rates.
The Bottom Line On Shandong Xinchao Energy's P/E
Shandong Xinchao Energy's P/E looks about as weak as its stock price lately. While the price-to-earnings ratio shouldn't be the defining factor in whether you buy a stock or not, it's quite a capable barometer of earnings expectations.
We've established that Shandong Xinchao Energy currently trades on a much lower than expected P/E since its recent three-year growth is higher than the wider market forecast. When we see strong earnings with faster-than-market growth, we assume potential risks are what might be placing significant pressure on the P/E ratio. It appears many are indeed anticipating earnings instability, because the persistence of these recent medium-term conditions would normally provide a boost to the share price.
Many other vital risk factors can be found on the company's balance sheet. Take a look at our free balance sheet analysis for Shandong Xinchao Energy with six simple checks on some of these key factors.
Of course, you might find a fantastic investment by looking at a few good candidates. So take a peek at this free list of companies with a strong growth track record, trading on a low P/E.
New: Manage All Your Stock Portfolios in One Place
We've created the ultimate portfolio companion for stock investors, and it's free.
• Connect an unlimited number of Portfolios and see your total in one currency
• Be alerted to new Warning Signs or Risks via email or mobile
• Track the Fair Value of your stocks
Have feedback on this article? Concerned about the content? Get in touch with us directly. Alternatively, email editorial-team (at) simplywallst.com.
This article by Simply Wall St is general in nature. We provide commentary based on historical data and analyst forecasts only using an unbiased methodology and our articles are not intended to be financial advice. It does not constitute a recommendation to buy or sell any stock, and does not take account of your objectives, or your financial situation. We aim to bring you long-term focused analysis driven by fundamental data. Note that our analysis may not factor in the latest price-sensitive company announcements or qualitative material. Simply Wall St has no position in any stocks mentioned.
About SHSE:600777
Shandong Xinchao Energy
Engages in the exploration, production, and sale of oil and natural gas.
Excellent balance sheet and good value.
Market Insights

Community Narratives
