- China
- /
- Diversified Financial
- /
- SHSE:600643
Shanghai Aj Group Co.,Ltd (SHSE:600643) Stock Rockets 28% As Investors Are Less Pessimistic Than Expected


Shanghai Aj Group Co.,Ltd (SHSE:600643) shareholders have had their patience rewarded with a 28% share price jump in the last month. The bad news is that even after the stocks recovery in the last 30 days, shareholders are still underwater by about 8.2% over the last year.
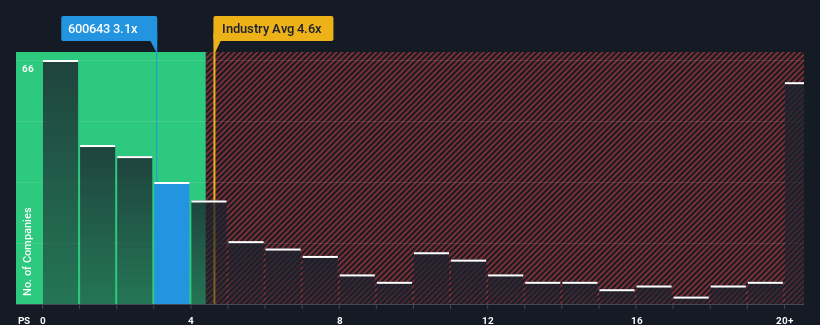
After such a large jump in price, when almost half of the companies in China's Diversified Financial industry have price-to-sales ratios (or "P/S") below 2x, you may consider Shanghai Aj GroupLtd as a stock probably not worth researching with its 3.1x P/S ratio. Nonetheless, we'd need to dig a little deeper to determine if there is a rational basis for the elevated P/S.
See our latest analysis for Shanghai Aj GroupLtd
What Does Shanghai Aj GroupLtd's P/S Mean For Shareholders?
The revenue growth achieved at Shanghai Aj GroupLtd over the last year would be more than acceptable for most companies. It might be that many expect the respectable revenue performance to beat most other companies over the coming period, which has increased investors’ willingness to pay up for the stock. However, if this isn't the case, investors might get caught out paying too much for the stock.
Although there are no analyst estimates available for Shanghai Aj GroupLtd, take a look at this free data-rich visualisation to see how the company stacks up on earnings, revenue and cash flow.Do Revenue Forecasts Match The High P/S Ratio?
There's an inherent assumption that a company should outperform the industry for P/S ratios like Shanghai Aj GroupLtd's to be considered reasonable.
Retrospectively, the last year delivered a decent 8.0% gain to the company's revenues. Still, lamentably revenue has fallen 45% in aggregate from three years ago, which is disappointing. So unfortunately, we have to acknowledge that the company has not done a great job of growing revenue over that time.
In contrast to the company, the rest of the industry is expected to grow by 2.3% over the next year, which really puts the company's recent medium-term revenue decline into perspective.
With this information, we find it concerning that Shanghai Aj GroupLtd is trading at a P/S higher than the industry. Apparently many investors in the company are way more bullish than recent times would indicate and aren't willing to let go of their stock at any price. There's a very good chance existing shareholders are setting themselves up for future disappointment if the P/S falls to levels more in line with the recent negative growth rates.
The Key Takeaway
Shanghai Aj GroupLtd's P/S is on the rise since its shares have risen strongly. It's argued the price-to-sales ratio is an inferior measure of value within certain industries, but it can be a powerful business sentiment indicator.
Our examination of Shanghai Aj GroupLtd revealed its shrinking revenue over the medium-term isn't resulting in a P/S as low as we expected, given the industry is set to grow. With a revenue decline on investors' minds, the likelihood of a souring sentiment is quite high which could send the P/S back in line with what we'd expect. Unless the recent medium-term conditions improve markedly, investors will have a hard time accepting the share price as fair value.
Before you settle on your opinion, we've discovered 2 warning signs for Shanghai Aj GroupLtd that you should be aware of.
If you're unsure about the strength of Shanghai Aj GroupLtd's business, why not explore our interactive list of stocks with solid business fundamentals for some other companies you may have missed.
If you're looking to trade Shanghai Aj GroupLtd, open an account with the lowest-cost platform trusted by professionals, Interactive Brokers.
With clients in over 200 countries and territories, and access to 160 markets, IBKR lets you trade stocks, options, futures, forex, bonds and funds from a single integrated account.
Enjoy no hidden fees, no account minimums, and FX conversion rates as low as 0.03%, far better than what most brokers offer.
Sponsored ContentNew: Manage All Your Stock Portfolios in One Place
We've created the ultimate portfolio companion for stock investors, and it's free.
• Connect an unlimited number of Portfolios and see your total in one currency
• Be alerted to new Warning Signs or Risks via email or mobile
• Track the Fair Value of your stocks
Have feedback on this article? Concerned about the content? Get in touch with us directly. Alternatively, email editorial-team (at) simplywallst.com.
This article by Simply Wall St is general in nature. We provide commentary based on historical data and analyst forecasts only using an unbiased methodology and our articles are not intended to be financial advice. It does not constitute a recommendation to buy or sell any stock, and does not take account of your objectives, or your financial situation. We aim to bring you long-term focused analysis driven by fundamental data. Note that our analysis may not factor in the latest price-sensitive company announcements or qualitative material. Simply Wall St has no position in any stocks mentioned.
About SHSE:600643
Shanghai Aj GroupLtd
Provides wealth and asset management services primarily for the financial industry in China.
Adequate balance sheet very low.
Market Insights

Community Narratives


