- China
- /
- Hospitality
- /
- SZSE:300859
A Look At The Intrinsic Value Of Western Regions Tourism Development Co.,Ltd (SZSE:300859)


Key Insights
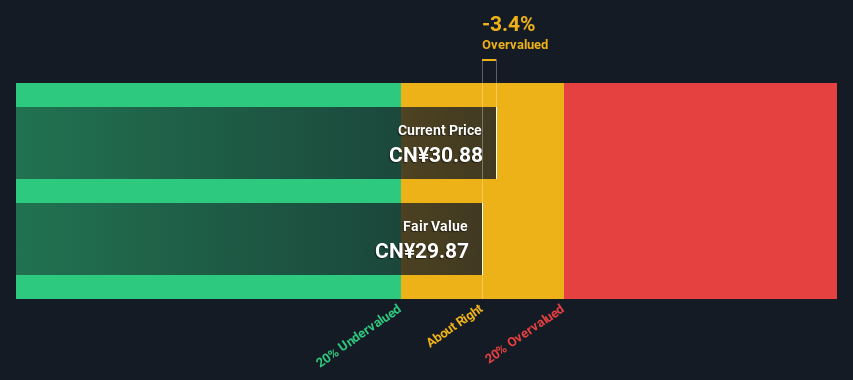
- The projected fair value for Western Regions Tourism DevelopmentLtd is CN¥29.87 based on 2 Stage Free Cash Flow to Equity
- Western Regions Tourism DevelopmentLtd's CN¥30.88 share price indicates it is trading at similar levels as its fair value estimate
- Industry average of 13,103% suggests Western Regions Tourism DevelopmentLtd's peers are currently trading at a higher premium to fair value
How far off is Western Regions Tourism Development Co.,Ltd (SZSE:300859) from its intrinsic value? Using the most recent financial data, we'll take a look at whether the stock is fairly priced by taking the expected future cash flows and discounting them to their present value. This will be done using the Discounted Cash Flow (DCF) model. It may sound complicated, but actually it is quite simple!
We generally believe that a company's value is the present value of all of the cash it will generate in the future. However, a DCF is just one valuation metric among many, and it is not without flaws. If you want to learn more about discounted cash flow, the rationale behind this calculation can be read in detail in the Simply Wall St analysis model.
View our latest analysis for Western Regions Tourism DevelopmentLtd
The Method
We use what is known as a 2-stage model, which simply means we have two different periods of growth rates for the company's cash flows. Generally the first stage is higher growth, and the second stage is a lower growth phase. To begin with, we have to get estimates of the next ten years of cash flows. Seeing as no analyst estimates of free cash flow are available to us, we have extrapolate the previous free cash flow (FCF) from the company's last reported value. We assume companies with shrinking free cash flow will slow their rate of shrinkage, and that companies with growing free cash flow will see their growth rate slow, over this period. We do this to reflect that growth tends to slow more in the early years than it does in later years.
A DCF is all about the idea that a dollar in the future is less valuable than a dollar today, and so the sum of these future cash flows is then discounted to today's value:
10-year free cash flow (FCF) forecast
| 2024 | 2025 | 2026 | 2027 | 2028 | 2029 | 2030 | 2031 | 2032 | 2033 | |
| Levered FCF (CN¥, Millions) | CN¥161.4m | CN¥202.6m | CN¥240.6m | CN¥274.3m | CN¥303.6m | CN¥329.0m | CN¥351.2m | CN¥370.8m | CN¥388.6m | CN¥405.1m |
| Growth Rate Estimate Source | Est @ 35.20% | Est @ 25.52% | Est @ 18.75% | Est @ 14.00% | Est @ 10.69% | Est @ 8.36% | Est @ 6.74% | Est @ 5.60% | Est @ 4.80% | Est @ 4.24% |
| Present Value (CN¥, Millions) Discounted @ 9.1% | CN¥148 | CN¥170 | CN¥185 | CN¥193 | CN¥196 | CN¥195 | CN¥191 | CN¥184 | CN¥177 | CN¥169 |
("Est" = FCF growth rate estimated by Simply Wall St)
Present Value of 10-year Cash Flow (PVCF) = CN¥1.8b
We now need to calculate the Terminal Value, which accounts for all the future cash flows after this ten year period. For a number of reasons a very conservative growth rate is used that cannot exceed that of a country's GDP growth. In this case we have used the 5-year average of the 10-year government bond yield (2.9%) to estimate future growth. In the same way as with the 10-year 'growth' period, we discount future cash flows to today's value, using a cost of equity of 9.1%.
Terminal Value (TV)= FCF2033 × (1 + g) ÷ (r – g) = CN¥405m× (1 + 2.9%) ÷ (9.1%– 2.9%) = CN¥6.7b
Present Value of Terminal Value (PVTV)= TV / (1 + r)10= CN¥6.7b÷ ( 1 + 9.1%)10= CN¥2.8b
The total value is the sum of cash flows for the next ten years plus the discounted terminal value, which results in the Total Equity Value, which in this case is CN¥4.6b. In the final step we divide the equity value by the number of shares outstanding. Relative to the current share price of CN¥30.9, the company appears around fair value at the time of writing. Valuations are imprecise instruments though, rather like a telescope - move a few degrees and end up in a different galaxy. Do keep this in mind.
Important Assumptions
Now the most important inputs to a discounted cash flow are the discount rate, and of course, the actual cash flows. Part of investing is coming up with your own evaluation of a company's future performance, so try the calculation yourself and check your own assumptions. The DCF also does not consider the possible cyclicality of an industry, or a company's future capital requirements, so it does not give a full picture of a company's potential performance. Given that we are looking at Western Regions Tourism DevelopmentLtd as potential shareholders, the cost of equity is used as the discount rate, rather than the cost of capital (or weighted average cost of capital, WACC) which accounts for debt. In this calculation we've used 9.1%, which is based on a levered beta of 1.097. Beta is a measure of a stock's volatility, compared to the market as a whole. We get our beta from the industry average beta of globally comparable companies, with an imposed limit between 0.8 and 2.0, which is a reasonable range for a stable business.
Moving On:
Although the valuation of a company is important, it shouldn't be the only metric you look at when researching a company. The DCF model is not a perfect stock valuation tool. Rather it should be seen as a guide to "what assumptions need to be true for this stock to be under/overvalued?" If a company grows at a different rate, or if its cost of equity or risk free rate changes sharply, the output can look very different. For Western Regions Tourism DevelopmentLtd, we've put together three further elements you should further examine:
- Risks: Be aware that Western Regions Tourism DevelopmentLtd is showing 1 warning sign in our investment analysis , you should know about...
- Other High Quality Alternatives: Do you like a good all-rounder? Explore our interactive list of high quality stocks to get an idea of what else is out there you may be missing!
- Other Top Analyst Picks: Interested to see what the analysts are thinking? Take a look at our interactive list of analysts' top stock picks to find out what they feel might have an attractive future outlook!
PS. The Simply Wall St app conducts a discounted cash flow valuation for every stock on the SZSE every day. If you want to find the calculation for other stocks just search here.
Valuation is complex, but we're here to simplify it.
Discover if Western Regions Tourism DevelopmentLtd might be undervalued or overvalued with our detailed analysis, featuring fair value estimates, potential risks, dividends, insider trades, and its financial condition.
Access Free AnalysisHave feedback on this article? Concerned about the content? Get in touch with us directly. Alternatively, email editorial-team (at) simplywallst.com.
This article by Simply Wall St is general in nature. We provide commentary based on historical data and analyst forecasts only using an unbiased methodology and our articles are not intended to be financial advice. It does not constitute a recommendation to buy or sell any stock, and does not take account of your objectives, or your financial situation. We aim to bring you long-term focused analysis driven by fundamental data. Note that our analysis may not factor in the latest price-sensitive company announcements or qualitative material. Simply Wall St has no position in any stocks mentioned.
About SZSE:300859
Western Regions Tourism DevelopmentLtd
Provides tourism and travel services in China.
Exceptional growth potential with excellent balance sheet.

