- China
- /
- Hospitality
- /
- SZSE:002059
Yunnan Tourism Co., Ltd.'s (SZSE:002059) Shares Climb 28% But Its Business Is Yet to Catch Up


Yunnan Tourism Co., Ltd. (SZSE:002059) shareholders would be excited to see that the share price has had a great month, posting a 28% gain and recovering from prior weakness. Not all shareholders will be feeling jubilant, since the share price is still down a very disappointing 14% in the last twelve months.
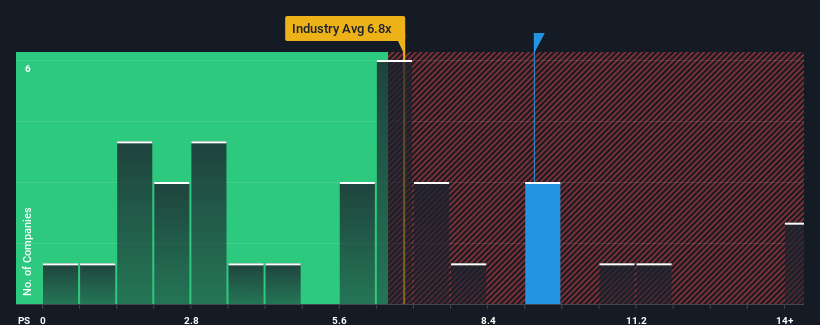
Following the firm bounce in price, Yunnan Tourism's price-to-sales (or "P/S") ratio of 9.3x might make it look like a sell right now compared to the wider Hospitality industry in China, where around half of the companies have P/S ratios below 6.8x and even P/S below 2x are quite common. Although, it's not wise to just take the P/S at face value as there may be an explanation why it's as high as it is.
View our latest analysis for Yunnan Tourism
What Does Yunnan Tourism's Recent Performance Look Like?
Yunnan Tourism certainly has been doing a great job lately as it's been growing its revenue at a really rapid pace. The P/S ratio is probably high because investors think this strong revenue growth will be enough to outperform the broader industry in the near future. However, if this isn't the case, investors might get caught out paying too much for the stock.
Although there are no analyst estimates available for Yunnan Tourism, take a look at this free data-rich visualisation to see how the company stacks up on earnings, revenue and cash flow.Is There Enough Revenue Growth Forecasted For Yunnan Tourism?
The only time you'd be truly comfortable seeing a P/S as high as Yunnan Tourism's is when the company's growth is on track to outshine the industry.
Retrospectively, the last year delivered an exceptional 33% gain to the company's top line. Despite this strong recent growth, it's still struggling to catch up as its three-year revenue frustratingly shrank by 60% overall. So unfortunately, we have to acknowledge that the company has not done a great job of growing revenues over that time.
Comparing that to the industry, which is predicted to deliver 29% growth in the next 12 months, the company's downward momentum based on recent medium-term revenue results is a sobering picture.
In light of this, it's alarming that Yunnan Tourism's P/S sits above the majority of other companies. Apparently many investors in the company are way more bullish than recent times would indicate and aren't willing to let go of their stock at any price. There's a very good chance existing shareholders are setting themselves up for future disappointment if the P/S falls to levels more in line with the recent negative growth rates.
What We Can Learn From Yunnan Tourism's P/S?
The large bounce in Yunnan Tourism's shares has lifted the company's P/S handsomely. It's argued the price-to-sales ratio is an inferior measure of value within certain industries, but it can be a powerful business sentiment indicator.
We've established that Yunnan Tourism currently trades on a much higher than expected P/S since its recent revenues have been in decline over the medium-term. Right now we aren't comfortable with the high P/S as this revenue performance is highly unlikely to support such positive sentiment for long. Unless the recent medium-term conditions improve markedly, investors will have a hard time accepting the share price as fair value.
Before you settle on your opinion, we've discovered 1 warning sign for Yunnan Tourism that you should be aware of.
It's important to make sure you look for a great company, not just the first idea you come across. So if growing profitability aligns with your idea of a great company, take a peek at this free list of interesting companies with strong recent earnings growth (and a low P/E).
New: Manage All Your Stock Portfolios in One Place
We've created the ultimate portfolio companion for stock investors, and it's free.
• Connect an unlimited number of Portfolios and see your total in one currency
• Be alerted to new Warning Signs or Risks via email or mobile
• Track the Fair Value of your stocks
Have feedback on this article? Concerned about the content? Get in touch with us directly. Alternatively, email editorial-team (at) simplywallst.com.
This article by Simply Wall St is general in nature. We provide commentary based on historical data and analyst forecasts only using an unbiased methodology and our articles are not intended to be financial advice. It does not constitute a recommendation to buy or sell any stock, and does not take account of your objectives, or your financial situation. We aim to bring you long-term focused analysis driven by fundamental data. Note that our analysis may not factor in the latest price-sensitive company announcements or qualitative material. Simply Wall St has no position in any stocks mentioned.
About SZSE:002059
Imperfect balance sheet minimal.
