
Advertisement
- China
- /
- Hospitality
- /
- SHSE:600749
Tibet Tourism Co.,Ltd's (SHSE:600749) 26% Share Price Surge Not Quite Adding Up
Tibet Tourism Co.,Ltd (SHSE:600749) shareholders would be excited to see that the share price has had a great month, posting a 26% gain and recovering from prior weakness. While recent buyers may be laughing, long-term holders might not be as pleased since the recent gain only brings the stock back to where it started a year ago.
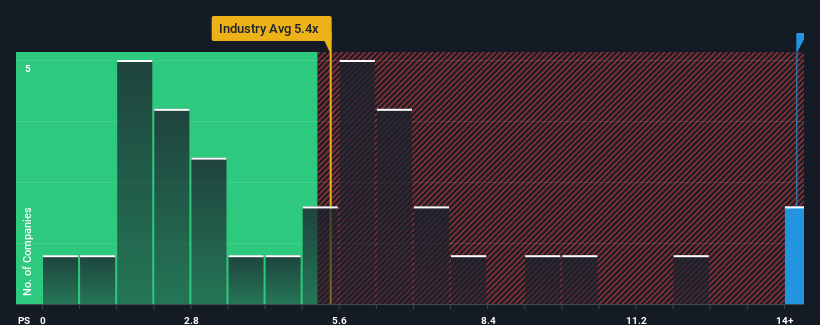
After such a large jump in price, Tibet TourismLtd's price-to-sales (or "P/S") ratio of 14.2x might make it look like a strong sell right now compared to other companies in the Hospitality industry in China, where around half of the companies have P/S ratios below 5.4x and even P/S below 2x are quite common. Although, it's not wise to just take the P/S at face value as there may be an explanation why it's so lofty.
See our latest analysis for Tibet TourismLtd
What Does Tibet TourismLtd's Recent Performance Look Like?
Tibet TourismLtd certainly has been doing a great job lately as it's been growing its revenue at a really rapid pace. It seems that many are expecting the strong revenue performance to beat most other companies over the coming period, which has increased investors’ willingness to pay up for the stock. You'd really hope so, otherwise you're paying a pretty hefty price for no particular reason.
Although there are no analyst estimates available for Tibet TourismLtd, take a look at this free data-rich visualisation to see how the company stacks up on earnings, revenue and cash flow.What Are Revenue Growth Metrics Telling Us About The High P/S?
In order to justify its P/S ratio, Tibet TourismLtd would need to produce outstanding growth that's well in excess of the industry.
If we review the last year of revenue growth, the company posted a terrific increase of 77%. The latest three year period has also seen an excellent 69% overall rise in revenue, aided by its short-term performance. Therefore, it's fair to say the revenue growth recently has been superb for the company.
Comparing the recent medium-term revenue trends against the industry's one-year growth forecast of 28% shows it's noticeably less attractive.
In light of this, it's alarming that Tibet TourismLtd's P/S sits above the majority of other companies. Apparently many investors in the company are way more bullish than recent times would indicate and aren't willing to let go of their stock at any price. Only the boldest would assume these prices are sustainable as a continuation of recent revenue trends is likely to weigh heavily on the share price eventually.
The Bottom Line On Tibet TourismLtd's P/S
The strong share price surge has lead to Tibet TourismLtd's P/S soaring as well. We'd say the price-to-sales ratio's power isn't primarily as a valuation instrument but rather to gauge current investor sentiment and future expectations.
Our examination of Tibet TourismLtd revealed its poor three-year revenue trends aren't detracting from the P/S as much as we though, given they look worse than current industry expectations. When we observe slower-than-industry revenue growth alongside a high P/S ratio, we assume there to be a significant risk of the share price decreasing, which would result in a lower P/S ratio. Unless the recent medium-term conditions improve markedly, it's very challenging to accept these the share price as being reasonable.
Don't forget that there may be other risks. For instance, we've identified 1 warning sign for Tibet TourismLtd that you should be aware of.
If these risks are making you reconsider your opinion on Tibet TourismLtd, explore our interactive list of high quality stocks to get an idea of what else is out there.
Valuation is complex, but we're here to simplify it.
Discover if Tibet TourismLtd might be undervalued or overvalued with our detailed analysis, featuring fair value estimates, potential risks, dividends, insider trades, and its financial condition.
Access Free AnalysisHave feedback on this article? Concerned about the content? Get in touch with us directly. Alternatively, email editorial-team (at) simplywallst.com.
This article by Simply Wall St is general in nature. We provide commentary based on historical data and analyst forecasts only using an unbiased methodology and our articles are not intended to be financial advice. It does not constitute a recommendation to buy or sell any stock, and does not take account of your objectives, or your financial situation. We aim to bring you long-term focused analysis driven by fundamental data. Note that our analysis may not factor in the latest price-sensitive company announcements or qualitative material. Simply Wall St has no position in any stocks mentioned.
About SHSE:600749
Tibet TourismLtd
Engages in the tourism, attractions, services, and commerce business in China.
Proven track record with adequate balance sheet.
Market Insights

Advertisement
Community Narratives

Apple: A Dying Star with an Overpriced Valuation
Fair Value US$177.34|18.9% overvalued
IN
Community Contributor
Avino a case for USD$20 per share within 5 years (assuming $3,500 gold, $100 silver and $4 copper).
Fair Value CA$26.79|87.5% undervalued
AG
Community Contributor
Riding the Defense Boom RENK Sees Revenue Climb at 15% CAGR by FY 2029
Fair Value €69.87|22.2% undervalued
CH
Community Contributor