Revenues Not Telling The Story For Goldlok Holdings(Guangdong) Co.,Ltd. (SZSE:002348) After Shares Rise 30%


Goldlok Holdings(Guangdong) Co.,Ltd. (SZSE:002348) shares have had a really impressive month, gaining 30% after a shaky period beforehand. Looking back a bit further, it's encouraging to see the stock is up 35% in the last year.
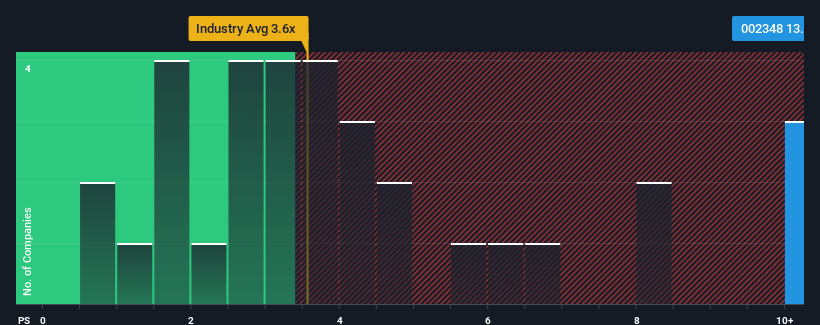
Following the firm bounce in price, you could be forgiven for thinking Goldlok Holdings(Guangdong)Ltd is a stock to steer clear of with a price-to-sales ratios (or "P/S") of 13.8x, considering almost half the companies in China's Leisure industry have P/S ratios below 3.6x. However, the P/S might be quite high for a reason and it requires further investigation to determine if it's justified.
View our latest analysis for Goldlok Holdings(Guangdong)Ltd
What Does Goldlok Holdings(Guangdong)Ltd's Recent Performance Look Like?
For instance, Goldlok Holdings(Guangdong)Ltd's receding revenue in recent times would have to be some food for thought. It might be that many expect the company to still outplay most other companies over the coming period, which has kept the P/S from collapsing. If not, then existing shareholders may be quite nervous about the viability of the share price.
Although there are no analyst estimates available for Goldlok Holdings(Guangdong)Ltd, take a look at this free data-rich visualisation to see how the company stacks up on earnings, revenue and cash flow.What Are Revenue Growth Metrics Telling Us About The High P/S?
The only time you'd be truly comfortable seeing a P/S as steep as Goldlok Holdings(Guangdong)Ltd's is when the company's growth is on track to outshine the industry decidedly.
Retrospectively, the last year delivered a frustrating 7.7% decrease to the company's top line. The last three years don't look nice either as the company has shrunk revenue by 45% in aggregate. So unfortunately, we have to acknowledge that the company has not done a great job of growing revenue over that time.
Weighing that medium-term revenue trajectory against the broader industry's one-year forecast for expansion of 22% shows it's an unpleasant look.
With this information, we find it concerning that Goldlok Holdings(Guangdong)Ltd is trading at a P/S higher than the industry. It seems most investors are ignoring the recent poor growth rate and are hoping for a turnaround in the company's business prospects. Only the boldest would assume these prices are sustainable as a continuation of recent revenue trends is likely to weigh heavily on the share price eventually.
What We Can Learn From Goldlok Holdings(Guangdong)Ltd's P/S?
Shares in Goldlok Holdings(Guangdong)Ltd have seen a strong upwards swing lately, which has really helped boost its P/S figure. It's argued the price-to-sales ratio is an inferior measure of value within certain industries, but it can be a powerful business sentiment indicator.
Our examination of Goldlok Holdings(Guangdong)Ltd revealed its shrinking revenue over the medium-term isn't resulting in a P/S as low as we expected, given the industry is set to grow. When we see revenue heading backwards and underperforming the industry forecasts, we feel the possibility of the share price declining is very real, bringing the P/S back into the realm of reasonability. Unless the recent medium-term conditions improve markedly, investors will have a hard time accepting the share price as fair value.
There are also other vital risk factors to consider before investing and we've discovered 1 warning sign for Goldlok Holdings(Guangdong)Ltd that you should be aware of.
If you're unsure about the strength of Goldlok Holdings(Guangdong)Ltd's business, why not explore our interactive list of stocks with solid business fundamentals for some other companies you may have missed.
New: Manage All Your Stock Portfolios in One Place
We've created the ultimate portfolio companion for stock investors, and it's free.
• Connect an unlimited number of Portfolios and see your total in one currency
• Be alerted to new Warning Signs or Risks via email or mobile
• Track the Fair Value of your stocks
Have feedback on this article? Concerned about the content? Get in touch with us directly. Alternatively, email editorial-team (at) simplywallst.com.
This article by Simply Wall St is general in nature. We provide commentary based on historical data and analyst forecasts only using an unbiased methodology and our articles are not intended to be financial advice. It does not constitute a recommendation to buy or sell any stock, and does not take account of your objectives, or your financial situation. We aim to bring you long-term focused analysis driven by fundamental data. Note that our analysis may not factor in the latest price-sensitive company announcements or qualitative material. Simply Wall St has no position in any stocks mentioned.
About SZSE:002348
Goldlok Holdings(Guangdong)Ltd
Engages in the toys and Internet education businesses in China.
Excellent balance sheet minimal.
Market Insights

Community Narratives

