
Advertisement
The Price Is Right For Shenzhen China Bicycle Company (Holdings) Limited (SZSE:000017) Even After Diving 34%
The Shenzhen China Bicycle Company (Holdings) Limited (SZSE:000017) share price has softened a substantial 34% over the previous 30 days, handing back much of the gains the stock has made lately. Still, a bad month hasn't completely ruined the past year with the stock gaining 84%, which is great even in a bull market.
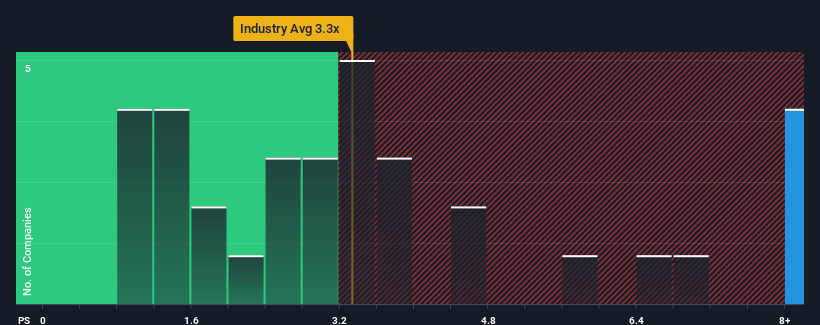
In spite of the heavy fall in price, when almost half of the companies in China's Leisure industry have price-to-sales ratios (or "P/S") below 3.3x, you may still consider Shenzhen China Bicycle Company (Holdings) as a stock not worth researching with its 9x P/S ratio. However, the P/S might be quite high for a reason and it requires further investigation to determine if it's justified.
View our latest analysis for Shenzhen China Bicycle Company (Holdings)
What Does Shenzhen China Bicycle Company (Holdings)'s P/S Mean For Shareholders?
Shenzhen China Bicycle Company (Holdings) certainly has been doing a great job lately as it's been growing its revenue at a really rapid pace. It seems that many are expecting the strong revenue performance to beat most other companies over the coming period, which has increased investors’ willingness to pay up for the stock. However, if this isn't the case, investors might get caught out paying too much for the stock.
Although there are no analyst estimates available for Shenzhen China Bicycle Company (Holdings), take a look at this free data-rich visualisation to see how the company stacks up on earnings, revenue and cash flow.How Is Shenzhen China Bicycle Company (Holdings)'s Revenue Growth Trending?
There's an inherent assumption that a company should far outperform the industry for P/S ratios like Shenzhen China Bicycle Company (Holdings)'s to be considered reasonable.
Retrospectively, the last year delivered an exceptional 179% gain to the company's top line. This great performance means it was also able to deliver immense revenue growth over the last three years. So we can start by confirming that the company has done a tremendous job of growing revenue over that time.
Comparing that recent medium-term revenue trajectory with the industry's one-year growth forecast of 19% shows it's noticeably more attractive.
With this information, we can see why Shenzhen China Bicycle Company (Holdings) is trading at such a high P/S compared to the industry. It seems most investors are expecting this strong growth to continue and are willing to pay more for the stock.
What Does Shenzhen China Bicycle Company (Holdings)'s P/S Mean For Investors?
Even after such a strong price drop, Shenzhen China Bicycle Company (Holdings)'s P/S still exceeds the industry median significantly. It's argued the price-to-sales ratio is an inferior measure of value within certain industries, but it can be a powerful business sentiment indicator.
It's no surprise that Shenzhen China Bicycle Company (Holdings) can support its high P/S given the strong revenue growth its experienced over the last three-year is superior to the current industry outlook. At this stage investors feel the potential continued revenue growth in the future is great enough to warrant an inflated P/S. Unless the recent medium-term conditions change, they will continue to provide strong support to the share price.
Don't forget that there may be other risks. For instance, we've identified 2 warning signs for Shenzhen China Bicycle Company (Holdings) that you should be aware of.
Of course, profitable companies with a history of great earnings growth are generally safer bets. So you may wish to see this free collection of other companies that have reasonable P/E ratios and have grown earnings strongly.
New: Manage All Your Stock Portfolios in One Place
We've created the ultimate portfolio companion for stock investors, and it's free.
• Connect an unlimited number of Portfolios and see your total in one currency
• Be alerted to new Warning Signs or Risks via email or mobile
• Track the Fair Value of your stocks
Have feedback on this article? Concerned about the content? Get in touch with us directly. Alternatively, email editorial-team (at) simplywallst.com.
This article by Simply Wall St is general in nature. We provide commentary based on historical data and analyst forecasts only using an unbiased methodology and our articles are not intended to be financial advice. It does not constitute a recommendation to buy or sell any stock, and does not take account of your objectives, or your financial situation. We aim to bring you long-term focused analysis driven by fundamental data. Note that our analysis may not factor in the latest price-sensitive company announcements or qualitative material. Simply Wall St has no position in any stocks mentioned.
About SZSE:000017
Shenzhen China Bicycle Company (Holdings)
Engages in the gold jewelry business.
Solid track record with adequate balance sheet.
Market Insights

Advertisement
Community Narratives
MicroVision will explode future revenue by 380.37% with a vision towards success
Fair Value US$60.00|98.3% undervalued
TH
Community Contributor
The Indispensable Artery for a New North American Economy
Fair Value CA$132.87|1.0% undervalued
TI
Community Contributor