
Advertisement
Aimer Co., Ltd.'s (SHSE:603511) Stock's Been Going Strong: Could Weak Financials Mean The Market Will Correct Its Share Price?
Aimer's (SHSE:603511) stock is up by a considerable 12% over the past week. We, however wanted to have a closer look at its key financial indicators as the markets usually pay for long-term fundamentals, and in this case, they don't look very promising. In this article, we decided to focus on Aimer's ROE.
Return on equity or ROE is a key measure used to assess how efficiently a company's management is utilizing the company's capital. In short, ROE shows the profit each dollar generates with respect to its shareholder investments.
Check out our latest analysis for Aimer
How Do You Calculate Return On Equity?
ROE can be calculated by using the formula:
Return on Equity = Net Profit (from continuing operations) ÷ Shareholders' Equity
So, based on the above formula, the ROE for Aimer is:
6.1% = CN¥269m ÷ CN¥4.4b (Based on the trailing twelve months to June 2024).
The 'return' refers to a company's earnings over the last year. That means that for every CN¥1 worth of shareholders' equity, the company generated CN¥0.06 in profit.
What Has ROE Got To Do With Earnings Growth?
We have already established that ROE serves as an efficient profit-generating gauge for a company's future earnings. We now need to evaluate how much profit the company reinvests or "retains" for future growth which then gives us an idea about the growth potential of the company. Generally speaking, other things being equal, firms with a high return on equity and profit retention, have a higher growth rate than firms that don’t share these attributes.
Aimer's Earnings Growth And 6.1% ROE
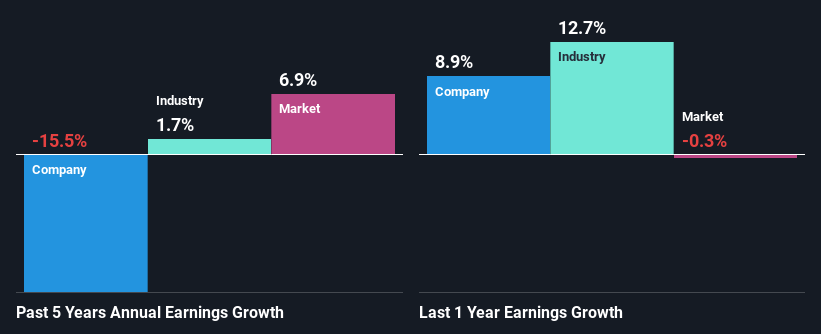
At first glance, Aimer's ROE doesn't look very promising. Next, when compared to the average industry ROE of 7.8%, the company's ROE leaves us feeling even less enthusiastic. For this reason, Aimer's five year net income decline of 16% is not surprising given its lower ROE. We believe that there also might be other aspects that are negatively influencing the company's earnings prospects. For instance, the company has a very high payout ratio, or is faced with competitive pressures.
So, as a next step, we compared Aimer's performance against the industry and were disappointed to discover that while the company has been shrinking its earnings, the industry has been growing its earnings at a rate of 1.7% over the last few years.
Earnings growth is an important metric to consider when valuing a stock. It’s important for an investor to know whether the market has priced in the company's expected earnings growth (or decline). By doing so, they will have an idea if the stock is headed into clear blue waters or if swampy waters await. One good indicator of expected earnings growth is the P/E ratio which determines the price the market is willing to pay for a stock based on its earnings prospects. So, you may want to check if Aimer is trading on a high P/E or a low P/E, relative to its industry.
Is Aimer Using Its Retained Earnings Effectively?
With a high three-year median payout ratio of 99% (implying that 1.3% of the profits are retained), most of Aimer's profits are being paid to shareholders, which explains the company's shrinking earnings. With only very little left to reinvest into the business, growth in earnings is far from likely. To know the 3 risks we have identified for Aimer visit our risks dashboard for free.
Moreover, Aimer has been paying dividends for three years, which is a considerable amount of time, suggesting that management must have perceived that the shareholders prefer consistent dividends even though earnings have been shrinking.
Conclusion
In total, we would have a hard think before deciding on any investment action concerning Aimer. The low ROE, combined with the fact that the company is paying out almost if not all, of its profits as dividends, has resulted in the lack or absence of growth in its earnings. Up till now, we've only made a short study of the company's growth data. You can do your own research on Aimer and see how it has performed in the past by looking at this FREE detailed graph of past earnings, revenue and cash flows.
New: Manage All Your Stock Portfolios in One Place
We've created the ultimate portfolio companion for stock investors, and it's free.
• Connect an unlimited number of Portfolios and see your total in one currency
• Be alerted to new Warning Signs or Risks via email or mobile
• Track the Fair Value of your stocks
Have feedback on this article? Concerned about the content? Get in touch with us directly. Alternatively, email editorial-team (at) simplywallst.com.
This article by Simply Wall St is general in nature. We provide commentary based on historical data and analyst forecasts only using an unbiased methodology and our articles are not intended to be financial advice. It does not constitute a recommendation to buy or sell any stock, and does not take account of your objectives, or your financial situation. We aim to bring you long-term focused analysis driven by fundamental data. Note that our analysis may not factor in the latest price-sensitive company announcements or qualitative material. Simply Wall St has no position in any stocks mentioned.
About SHSE:603511
Aimer
Engages in the development, production, and sale of intimate apparel for men, women, and children in China and internationally.
Flawless balance sheet with slight risk.
Similar Companies
Market Insights

Advertisement
Community Narratives
Quality at a Premium. A time to watch, not to buy?
Fair Value US$154.56|29.9% undervalued
DA
Community Contributor
GRAB: The Super-App at the Heart of Southeast Asia’s Digital Boom
Fair Value US$8.20|22.9% undervalued
BL
Community Contributor
Verve Group to Surge with 51.61% Revenue Growth
Fair Value €6.00|64.1% undervalued
ME
Community Contributor