- China
- /
- Consumer Durables
- /
- SHSE:600839
Sichuan Changhong ElectricLtd (SHSE:600839) Might Have The Makings Of A Multi-Bagger


To find a multi-bagger stock, what are the underlying trends we should look for in a business? In a perfect world, we'd like to see a company investing more capital into its business and ideally the returns earned from that capital are also increasing. Put simply, these types of businesses are compounding machines, meaning they are continually reinvesting their earnings at ever-higher rates of return. With that in mind, we've noticed some promising trends at Sichuan Changhong ElectricLtd (SHSE:600839) so let's look a bit deeper.
Return On Capital Employed (ROCE): What Is It?
For those who don't know, ROCE is a measure of a company's yearly pre-tax profit (its return), relative to the capital employed in the business. To calculate this metric for Sichuan Changhong ElectricLtd, this is the formula:
Return on Capital Employed = Earnings Before Interest and Tax (EBIT) ÷ (Total Assets - Current Liabilities)
0.055 = CN¥1.6b ÷ (CN¥95b - CN¥66b) (Based on the trailing twelve months to June 2024).
So, Sichuan Changhong ElectricLtd has an ROCE of 5.5%. Ultimately, that's a low return and it under-performs the Consumer Durables industry average of 9.0%.
View our latest analysis for Sichuan Changhong ElectricLtd
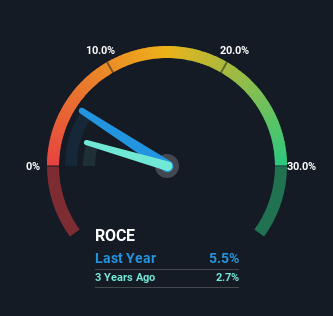
Historical performance is a great place to start when researching a stock so above you can see the gauge for Sichuan Changhong ElectricLtd's ROCE against it's prior returns. If you want to delve into the historical earnings , check out these free graphs detailing revenue and cash flow performance of Sichuan Changhong ElectricLtd.
What Does the ROCE Trend For Sichuan Changhong ElectricLtd Tell Us?
Sichuan Changhong ElectricLtd has not disappointed with their ROCE growth. Looking at the data, we can see that even though capital employed in the business has remained relatively flat, the ROCE generated has risen by 145% over the last five years. So it's likely that the business is now reaping the full benefits of its past investments, since the capital employed hasn't changed considerably. The company is doing well in that sense, and it's worth investigating what the management team has planned for long term growth prospects.
Another thing to note, Sichuan Changhong ElectricLtd has a high ratio of current liabilities to total assets of 70%. This can bring about some risks because the company is basically operating with a rather large reliance on its suppliers or other sorts of short-term creditors. Ideally we'd like to see this reduce as that would mean fewer obligations bearing risks.
The Key Takeaway
As discussed above, Sichuan Changhong ElectricLtd appears to be getting more proficient at generating returns since capital employed has remained flat but earnings (before interest and tax) are up. And investors seem to expect more of this going forward, since the stock has rewarded shareholders with a 69% return over the last five years. Therefore, we think it would be worth your time to check if these trends are going to continue.
If you want to continue researching Sichuan Changhong ElectricLtd, you might be interested to know about the 3 warning signs that our analysis has discovered.
If you want to search for solid companies with great earnings, check out this free list of companies with good balance sheets and impressive returns on equity.
If you're looking to trade Sichuan Changhong ElectricLtd, open an account with the lowest-cost platform trusted by professionals, Interactive Brokers.
With clients in over 200 countries and territories, and access to 160 markets, IBKR lets you trade stocks, options, futures, forex, bonds and funds from a single integrated account.
Enjoy no hidden fees, no account minimums, and FX conversion rates as low as 0.03%, far better than what most brokers offer.
Sponsored ContentNew: Manage All Your Stock Portfolios in One Place
We've created the ultimate portfolio companion for stock investors, and it's free.
• Connect an unlimited number of Portfolios and see your total in one currency
• Be alerted to new Warning Signs or Risks via email or mobile
• Track the Fair Value of your stocks
Have feedback on this article? Concerned about the content? Get in touch with us directly. Alternatively, email editorial-team (at) simplywallst.com.
This article by Simply Wall St is general in nature. We provide commentary based on historical data and analyst forecasts only using an unbiased methodology and our articles are not intended to be financial advice. It does not constitute a recommendation to buy or sell any stock, and does not take account of your objectives, or your financial situation. We aim to bring you long-term focused analysis driven by fundamental data. Note that our analysis may not factor in the latest price-sensitive company announcements or qualitative material. Simply Wall St has no position in any stocks mentioned.
About SHSE:600839
Sichuan Changhong ElectricLtd
Researches, develops, manufactures, and sells consumer electronics products in China and internationally.
Excellent balance sheet average dividend payer.
Market Insights

Community Narratives

