- China
- /
- Commercial Services
- /
- SZSE:300949
Some Shenzhen L&A Design Holding Limited (SZSE:300949) Shareholders Look For Exit As Shares Take 26% Pounding


Unfortunately for some shareholders, the Shenzhen L&A Design Holding Limited (SZSE:300949) share price has dived 26% in the last thirty days, prolonging recent pain. Instead of being rewarded, shareholders who have already held through the last twelve months are now sitting on a 11% share price drop.
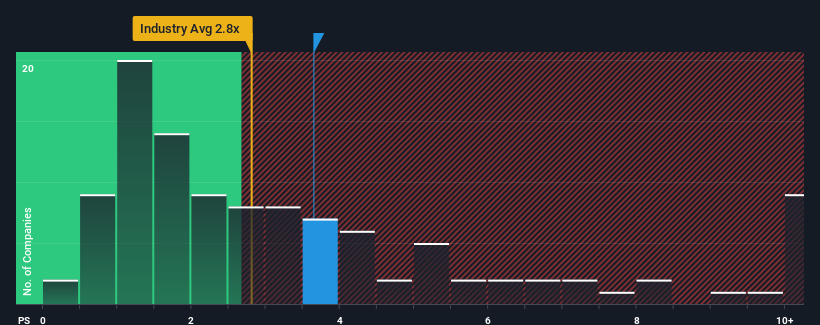
In spite of the heavy fall in price, given close to half the companies operating in China's Commercial Services industry have price-to-sales ratios (or "P/S") below 2.8x, you may still consider Shenzhen L&A Design Holding as a stock to potentially avoid with its 3.6x P/S ratio. However, the P/S might be high for a reason and it requires further investigation to determine if it's justified.
See our latest analysis for Shenzhen L&A Design Holding
How Has Shenzhen L&A Design Holding Performed Recently?
The recent revenue growth at Shenzhen L&A Design Holding would have to be considered satisfactory if not spectacular. One possibility is that the P/S ratio is high because investors think this good revenue growth will be enough to outperform the broader industry in the near future. You'd really hope so, otherwise you're paying a pretty hefty price for no particular reason.
Although there are no analyst estimates available for Shenzhen L&A Design Holding, take a look at this free data-rich visualisation to see how the company stacks up on earnings, revenue and cash flow.Is There Enough Revenue Growth Forecasted For Shenzhen L&A Design Holding?
In order to justify its P/S ratio, Shenzhen L&A Design Holding would need to produce impressive growth in excess of the industry.
Taking a look back first, we see that the company managed to grow revenues by a handy 5.1% last year. The solid recent performance means it was also able to grow revenue by 10% in total over the last three years. Accordingly, shareholders would have probably been satisfied with the medium-term rates of revenue growth.
Comparing that to the industry, which is predicted to deliver 28% growth in the next 12 months, the company's momentum is weaker, based on recent medium-term annualised revenue results.
With this information, we find it concerning that Shenzhen L&A Design Holding is trading at a P/S higher than the industry. Apparently many investors in the company are way more bullish than recent times would indicate and aren't willing to let go of their stock at any price. Only the boldest would assume these prices are sustainable as a continuation of recent revenue trends is likely to weigh heavily on the share price eventually.
The Key Takeaway
Shenzhen L&A Design Holding's P/S remain high even after its stock plunged. While the price-to-sales ratio shouldn't be the defining factor in whether you buy a stock or not, it's quite a capable barometer of revenue expectations.
The fact that Shenzhen L&A Design Holding currently trades on a higher P/S relative to the industry is an oddity, since its recent three-year growth is lower than the wider industry forecast. When we observe slower-than-industry revenue growth alongside a high P/S ratio, we assume there to be a significant risk of the share price decreasing, which would result in a lower P/S ratio. If recent medium-term revenue trends continue, it will place shareholders' investments at significant risk and potential investors in danger of paying an excessive premium.
You should always think about risks. Case in point, we've spotted 2 warning signs for Shenzhen L&A Design Holding you should be aware of.
Of course, profitable companies with a history of great earnings growth are generally safer bets. So you may wish to see this free collection of other companies that have reasonable P/E ratios and have grown earnings strongly.
If you're looking to trade Shenzhen L&A Design Holding, open an account with the lowest-cost platform trusted by professionals, Interactive Brokers.
With clients in over 200 countries and territories, and access to 160 markets, IBKR lets you trade stocks, options, futures, forex, bonds and funds from a single integrated account.
Enjoy no hidden fees, no account minimums, and FX conversion rates as low as 0.03%, far better than what most brokers offer.
Sponsored ContentNew: Manage All Your Stock Portfolios in One Place
We've created the ultimate portfolio companion for stock investors, and it's free.
• Connect an unlimited number of Portfolios and see your total in one currency
• Be alerted to new Warning Signs or Risks via email or mobile
• Track the Fair Value of your stocks
Have feedback on this article? Concerned about the content? Get in touch with us directly. Alternatively, email editorial-team (at) simplywallst.com.
This article by Simply Wall St is general in nature. We provide commentary based on historical data and analyst forecasts only using an unbiased methodology and our articles are not intended to be financial advice. It does not constitute a recommendation to buy or sell any stock, and does not take account of your objectives, or your financial situation. We aim to bring you long-term focused analysis driven by fundamental data. Note that our analysis may not factor in the latest price-sensitive company announcements or qualitative material. Simply Wall St has no position in any stocks mentioned.
About SZSE:300949
Shenzhen L&A Design Holding
Engages in the land planning, urban design, landscape architecture, and resort planning businesses in China.
Excellent balance sheet very low.
Market Insights

Community Narratives


