- China
- /
- Commercial Services
- /
- SZSE:300901
There's Reason For Concern Over Zhejiang Zoenn Design Co., Ltd.'s (SZSE:300901) Massive 27% Price Jump


Zhejiang Zoenn Design Co., Ltd. (SZSE:300901) shareholders would be excited to see that the share price has had a great month, posting a 27% gain and recovering from prior weakness. Not all shareholders will be feeling jubilant, since the share price is still down a very disappointing 30% in the last twelve months.
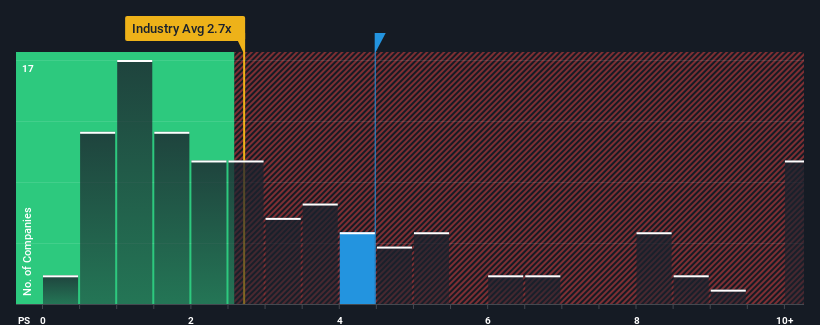
After such a large jump in price, given close to half the companies operating in China's Commercial Services industry have price-to-sales ratios (or "P/S") below 2.7x, you may consider Zhejiang Zoenn Design as a stock to potentially avoid with its 4.5x P/S ratio. Although, it's not wise to just take the P/S at face value as there may be an explanation why it's as high as it is.
Check out our latest analysis for Zhejiang Zoenn Design
What Does Zhejiang Zoenn Design's Recent Performance Look Like?
For example, consider that Zhejiang Zoenn Design's financial performance has been poor lately as its revenue has been in decline. Perhaps the market believes the company can do enough to outperform the rest of the industry in the near future, which is keeping the P/S ratio high. However, if this isn't the case, investors might get caught out paying too much for the stock.
Want the full picture on earnings, revenue and cash flow for the company? Then our free report on Zhejiang Zoenn Design will help you shine a light on its historical performance.Do Revenue Forecasts Match The High P/S Ratio?
Zhejiang Zoenn Design's P/S ratio would be typical for a company that's expected to deliver solid growth, and importantly, perform better than the industry.
Taking a look back first, the company's revenue growth last year wasn't something to get excited about as it posted a disappointing decline of 15%. As a result, revenue from three years ago have also fallen 25% overall. Accordingly, shareholders would have felt downbeat about the medium-term rates of revenue growth.
In contrast to the company, the rest of the industry is expected to grow by 30% over the next year, which really puts the company's recent medium-term revenue decline into perspective.
In light of this, it's alarming that Zhejiang Zoenn Design's P/S sits above the majority of other companies. It seems most investors are ignoring the recent poor growth rate and are hoping for a turnaround in the company's business prospects. There's a very good chance existing shareholders are setting themselves up for future disappointment if the P/S falls to levels more in line with the recent negative growth rates.
The Bottom Line On Zhejiang Zoenn Design's P/S
The large bounce in Zhejiang Zoenn Design's shares has lifted the company's P/S handsomely. Using the price-to-sales ratio alone to determine if you should sell your stock isn't sensible, however it can be a practical guide to the company's future prospects.
We've established that Zhejiang Zoenn Design currently trades on a much higher than expected P/S since its recent revenues have been in decline over the medium-term. With a revenue decline on investors' minds, the likelihood of a souring sentiment is quite high which could send the P/S back in line with what we'd expect. If recent medium-term revenue trends continue, it will place shareholders' investments at significant risk and potential investors in danger of paying an excessive premium.
And what about other risks? Every company has them, and we've spotted 5 warning signs for Zhejiang Zoenn Design (of which 4 are significant!) you should know about.
If companies with solid past earnings growth is up your alley, you may wish to see this free collection of other companies with strong earnings growth and low P/E ratios.
If you're looking to trade Zhejiang Zoenn Design, open an account with the lowest-cost platform trusted by professionals, Interactive Brokers.
With clients in over 200 countries and territories, and access to 160 markets, IBKR lets you trade stocks, options, futures, forex, bonds and funds from a single integrated account.
Enjoy no hidden fees, no account minimums, and FX conversion rates as low as 0.03%, far better than what most brokers offer.
Sponsored ContentValuation is complex, but we're here to simplify it.
Discover if Zhejiang Zoenn Design might be undervalued or overvalued with our detailed analysis, featuring fair value estimates, potential risks, dividends, insider trades, and its financial condition.
Access Free AnalysisHave feedback on this article? Concerned about the content? Get in touch with us directly. Alternatively, email editorial-team (at) simplywallst.com.
This article by Simply Wall St is general in nature. We provide commentary based on historical data and analyst forecasts only using an unbiased methodology and our articles are not intended to be financial advice. It does not constitute a recommendation to buy or sell any stock, and does not take account of your objectives, or your financial situation. We aim to bring you long-term focused analysis driven by fundamental data. Note that our analysis may not factor in the latest price-sensitive company announcements or qualitative material. Simply Wall St has no position in any stocks mentioned.
About SZSE:300901
Zhejiang Zoenn Design
Provides supply chain integration services in China.
Mediocre balance sheet very low.
Market Insights

Community Narratives


