- China
- /
- Professional Services
- /
- SZSE:300500
Why Investors Shouldn't Be Surprised By Tus-Design Group Co., Ltd.'s (SZSE:300500) 29% Share Price Plunge


To the annoyance of some shareholders, Tus-Design Group Co., Ltd. (SZSE:300500) shares are down a considerable 29% in the last month, which continues a horrid run for the company. Instead of being rewarded, shareholders who have already held through the last twelve months are now sitting on a 45% share price drop.
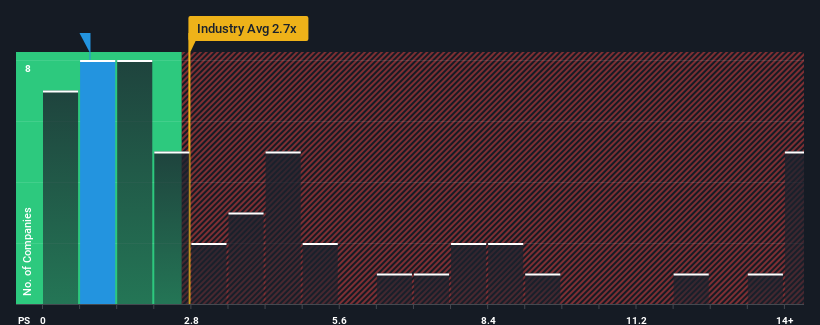
After such a large drop in price, Tus-Design Group may be sending bullish signals at the moment with its price-to-sales (or "P/S") ratio of 0.9x, since almost half of all companies in the Professional Services industry in China have P/S ratios greater than 2.7x and even P/S higher than 8x are not unusual. Although, it's not wise to just take the P/S at face value as there may be an explanation why it's limited.
View our latest analysis for Tus-Design Group
How Tus-Design Group Has Been Performing
As an illustration, revenue has deteriorated at Tus-Design Group over the last year, which is not ideal at all. One possibility is that the P/S is low because investors think the company won't do enough to avoid underperforming the broader industry in the near future. If you like the company, you'd be hoping this isn't the case so that you could potentially pick up some stock while it's out of favour.
Want the full picture on earnings, revenue and cash flow for the company? Then our free report on Tus-Design Group will help you shine a light on its historical performance.Do Revenue Forecasts Match The Low P/S Ratio?
Tus-Design Group's P/S ratio would be typical for a company that's only expected to deliver limited growth, and importantly, perform worse than the industry.
Taking a look back first, the company's revenue growth last year wasn't something to get excited about as it posted a disappointing decline of 12%. Regardless, revenue has managed to lift by a handy 13% in aggregate from three years ago, thanks to the earlier period of growth. Accordingly, while they would have preferred to keep the run going, shareholders would be roughly satisfied with the medium-term rates of revenue growth.
This is in contrast to the rest of the industry, which is expected to grow by 94% over the next year, materially higher than the company's recent medium-term annualised growth rates.
In light of this, it's understandable that Tus-Design Group's P/S sits below the majority of other companies. It seems most investors are expecting to see the recent limited growth rates continue into the future and are only willing to pay a reduced amount for the stock.
What We Can Learn From Tus-Design Group's P/S?
Tus-Design Group's recently weak share price has pulled its P/S back below other Professional Services companies. We'd say the price-to-sales ratio's power isn't primarily as a valuation instrument but rather to gauge current investor sentiment and future expectations.
In line with expectations, Tus-Design Group maintains its low P/S on the weakness of its recent three-year growth being lower than the wider industry forecast. At this stage investors feel the potential for an improvement in revenue isn't great enough to justify a higher P/S ratio. Unless the recent medium-term conditions improve, they will continue to form a barrier for the share price around these levels.
You always need to take note of risks, for example - Tus-Design Group has 3 warning signs we think you should be aware of.
It's important to make sure you look for a great company, not just the first idea you come across. So if growing profitability aligns with your idea of a great company, take a peek at this free list of interesting companies with strong recent earnings growth (and a low P/E).
Valuation is complex, but we're here to simplify it.
Discover if Tus-Design Group might be undervalued or overvalued with our detailed analysis, featuring fair value estimates, potential risks, dividends, insider trades, and its financial condition.
Access Free AnalysisHave feedback on this article? Concerned about the content? Get in touch with us directly. Alternatively, email editorial-team (at) simplywallst.com.
This article by Simply Wall St is general in nature. We provide commentary based on historical data and analyst forecasts only using an unbiased methodology and our articles are not intended to be financial advice. It does not constitute a recommendation to buy or sell any stock, and does not take account of your objectives, or your financial situation. We aim to bring you long-term focused analysis driven by fundamental data. Note that our analysis may not factor in the latest price-sensitive company announcements or qualitative material. Simply Wall St has no position in any stocks mentioned.
About SZSE:300500
Adequate balance sheet low.
Market Insights

Community Narratives

