
Advertisement
- China
- /
- Commercial Services
- /
- SZSE:300237
There's No Escaping Shandong Meichen Science & Technology Co.,Ltd.'s (SZSE:300237) Muted Revenues Despite A 44% Share Price Rise
Despite an already strong run, Shandong Meichen Science & Technology Co.,Ltd. (SZSE:300237) shares have been powering on, with a gain of 44% in the last thirty days. But the gains over the last month weren't enough to make shareholders whole, as the share price is still down 3.1% in the last twelve months.
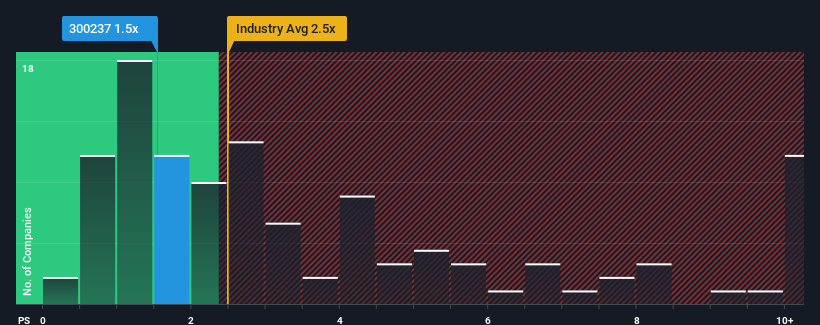
In spite of the firm bounce in price, Shandong Meichen Science & TechnologyLtd may still be sending buy signals at present with its price-to-sales (or "P/S") ratio of 1.5x, considering almost half of all companies in the Commercial Services industry in China have P/S ratios greater than 2.5x and even P/S higher than 5x aren't out of the ordinary. Nonetheless, we'd need to dig a little deeper to determine if there is a rational basis for the reduced P/S.
View our latest analysis for Shandong Meichen Science & TechnologyLtd
What Does Shandong Meichen Science & TechnologyLtd's P/S Mean For Shareholders?
The revenue growth achieved at Shandong Meichen Science & TechnologyLtd over the last year would be more than acceptable for most companies. Perhaps the market is expecting this acceptable revenue performance to take a dive, which has kept the P/S suppressed. If that doesn't eventuate, then existing shareholders have reason to be optimistic about the future direction of the share price.
Want the full picture on earnings, revenue and cash flow for the company? Then our free report on Shandong Meichen Science & TechnologyLtd will help you shine a light on its historical performance.Do Revenue Forecasts Match The Low P/S Ratio?
The only time you'd be truly comfortable seeing a P/S as low as Shandong Meichen Science & TechnologyLtd's is when the company's growth is on track to lag the industry.
Taking a look back first, we see that the company grew revenue by an impressive 28% last year. However, this wasn't enough as the latest three year period has seen the company endure a nasty 39% drop in revenue in aggregate. Therefore, it's fair to say the revenue growth recently has been undesirable for the company.
Comparing that to the industry, which is predicted to deliver 28% growth in the next 12 months, the company's downward momentum based on recent medium-term revenue results is a sobering picture.
In light of this, it's understandable that Shandong Meichen Science & TechnologyLtd's P/S would sit below the majority of other companies. Nonetheless, there's no guarantee the P/S has reached a floor yet with revenue going in reverse. There's potential for the P/S to fall to even lower levels if the company doesn't improve its top-line growth.
The Bottom Line On Shandong Meichen Science & TechnologyLtd's P/S
Shandong Meichen Science & TechnologyLtd's stock price has surged recently, but its but its P/S still remains modest. We'd say the price-to-sales ratio's power isn't primarily as a valuation instrument but rather to gauge current investor sentiment and future expectations.
It's no surprise that Shandong Meichen Science & TechnologyLtd maintains its low P/S off the back of its sliding revenue over the medium-term. At this stage investors feel the potential for an improvement in revenue isn't great enough to justify a higher P/S ratio. Given the current circumstances, it seems unlikely that the share price will experience any significant movement in either direction in the near future if recent medium-term revenue trends persist.
Before you settle on your opinion, we've discovered 3 warning signs for Shandong Meichen Science & TechnologyLtd that you should be aware of.
Of course, profitable companies with a history of great earnings growth are generally safer bets. So you may wish to see this free collection of other companies that have reasonable P/E ratios and have grown earnings strongly.
New: Manage All Your Stock Portfolios in One Place
We've created the ultimate portfolio companion for stock investors, and it's free.
• Connect an unlimited number of Portfolios and see your total in one currency
• Be alerted to new Warning Signs or Risks via email or mobile
• Track the Fair Value of your stocks
Have feedback on this article? Concerned about the content? Get in touch with us directly. Alternatively, email editorial-team (at) simplywallst.com.
This article by Simply Wall St is general in nature. We provide commentary based on historical data and analyst forecasts only using an unbiased methodology and our articles are not intended to be financial advice. It does not constitute a recommendation to buy or sell any stock, and does not take account of your objectives, or your financial situation. We aim to bring you long-term focused analysis driven by fundamental data. Note that our analysis may not factor in the latest price-sensitive company announcements or qualitative material. Simply Wall St has no position in any stocks mentioned.
About SZSE:300237
Shandong Meichen Technology Group
Shandong Meichen Technology Group Co., Ltd.
Low risk and slightly overvalued.
Market Insights

Advertisement
Weekly Picks
RO


RockeTeller on Santacruz Silver Mining ·
Crazy Undervalued 42 Baggers Silver Play (Active & Running Mine)
Fair Value:CA$8696.7% undervalued
72 followersusers have followed this narrative
7 commentsusers have commented on this narrative
20 likesusers have liked this narrative
RO


Robbo on Fiducian Group ·
Fiducian: Compliance Clouds or Value Opportunity?
Fair Value:AU$121.2% undervalued
12 followersusers have followed this narrative
0 commentsusers have commented on this narrative
1 likeusers have liked this narrative
WO

woodworthfund on Willamette Valley Vineyards ·
Willamette Valley Vineyards (WVVI): Not-So-Great Value
Fair Value:US$245.0% overvalued
11 followersusers have followed this narrative
0 commentsusers have commented on this narrative
1 likeusers have liked this narrative
Recently Updated Narratives
DA


davidlsander on Beam Therapeutics ·
The "Molecular Pencil": Why Beam's Technology is Built to Win
Fair Value:US$15081.9% undervalued
56 followersusers have followed this narrative
3 commentsusers have commented on this narrative
0 likesusers have liked this narrative
RE

RedhawkCC on Prime Medicine ·
PRME remains a long shot but publication in the New England Journal of Medicine helps.
Fair Value:US$0.0469.1k% overvalued
1 followerusers have followed this narrative
0 commentsusers have commented on this narrative
0 likesusers have liked this narrative
RA

RacerBVN on iShares Trust - iShares Preferred and Income Securities ETF ·
This one is all about the tax benefits
Fair Value:US$54.5543.4% undervalued
2 followersusers have followed this narrative
0 commentsusers have commented on this narrative
0 likesusers have liked this narrative
Popular Narratives
TH


TheWallstreetKing on MicroVision ·
MicroVision will explode future revenue by 380.37% with a vision towards success
Fair Value:US$6098.5% undervalued
118 followersusers have followed this narrative
11 commentsusers have commented on this narrative
22 likesusers have liked this narrative
AN


AnalystConsensusTarget on NVIDIA ·
NVDA: Expanding AI Demand Will Drive Major Data Center Investments Through 2026
Fair Value:US$250.3925.9% undervalued
961 followersusers have followed this narrative
6 commentsusers have commented on this narrative
25 likesusers have liked this narrative
RO
RockeTeller on Santacruz Silver Mining ·
Crazy Undervalued 42 Baggers Silver Play (Active & Running Mine)
Fair Value:CA$8696.7% undervalued
72 followersusers have followed this narrative
7 commentsusers have commented on this narrative
20 likesusers have liked this narrative
