
Advertisement
- China
- /
- Professional Services
- /
- SHSE:603017
ARTS Group Co., Ltd (SHSE:603017) Is Going Strong But Fundamentals Appear To Be Mixed : Is There A Clear Direction For The Stock?
Most readers would already be aware that ARTS Group's (SHSE:603017) stock increased significantly by 12% over the past week. But the company's key financial indicators appear to be differing across the board and that makes us question whether or not the company's current share price momentum can be maintained. Specifically, we decided to study ARTS Group's ROE in this article.
Return on Equity or ROE is a test of how effectively a company is growing its value and managing investors’ money. Put another way, it reveals the company's success at turning shareholder investments into profits.
See our latest analysis for ARTS Group
How To Calculate Return On Equity?
Return on equity can be calculated by using the formula:
Return on Equity = Net Profit (from continuing operations) ÷ Shareholders' Equity
So, based on the above formula, the ROE for ARTS Group is:
6.6% = CN¥101m ÷ CN¥1.5b (Based on the trailing twelve months to June 2024).
The 'return' is the profit over the last twelve months. So, this means that for every CN¥1 of its shareholder's investments, the company generates a profit of CN¥0.07.
Why Is ROE Important For Earnings Growth?
We have already established that ROE serves as an efficient profit-generating gauge for a company's future earnings. Based on how much of its profits the company chooses to reinvest or "retain", we are then able to evaluate a company's future ability to generate profits. Assuming all else is equal, companies that have both a higher return on equity and higher profit retention are usually the ones that have a higher growth rate when compared to companies that don't have the same features.
ARTS Group's Earnings Growth And 6.6% ROE
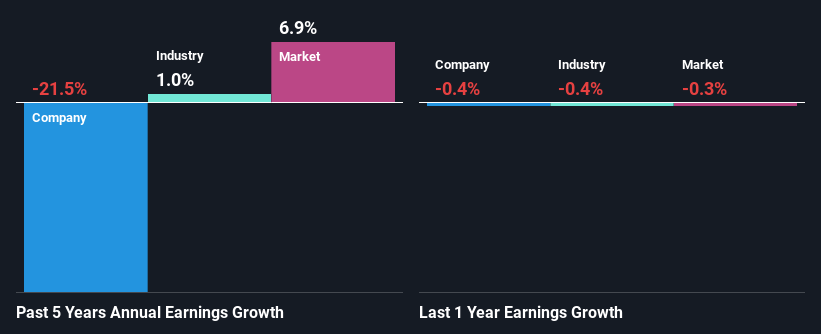
On the face of it, ARTS Group's ROE is not much to talk about. Yet, a closer study shows that the company's ROE is similar to the industry average of 6.4%. But then again, ARTS Group's five year net income shrunk at a rate of 21%. Bear in mind, the company does have a slightly low ROE. Therefore, the decline in earnings could also be the result of this.
So, as a next step, we compared ARTS Group's performance against the industry and were disappointed to discover that while the company has been shrinking its earnings, the industry has been growing its earnings at a rate of 1.0% over the last few years.
The basis for attaching value to a company is, to a great extent, tied to its earnings growth. What investors need to determine next is if the expected earnings growth, or the lack of it, is already built into the share price. By doing so, they will have an idea if the stock is headed into clear blue waters or if swampy waters await. One good indicator of expected earnings growth is the P/E ratio which determines the price the market is willing to pay for a stock based on its earnings prospects. So, you may want to check if ARTS Group is trading on a high P/E or a low P/E, relative to its industry.
Is ARTS Group Using Its Retained Earnings Effectively?
While the company did payout a portion of its dividend in the past, it currently doesn't pay a regular dividend. This implies that potentially all of its profits are being reinvested in the business.
Summary
In total, we're a bit ambivalent about ARTS Group's performance. Even though it appears to be retaining most of its profits, given the low ROE, investors may not be benefitting from all that reinvestment after all. The low earnings growth suggests our theory correct. Up till now, we've only made a short study of the company's growth data. To gain further insights into ARTS Group's past profit growth, check out this visualization of past earnings, revenue and cash flows.
New: Manage All Your Stock Portfolios in One Place
We've created the ultimate portfolio companion for stock investors, and it's free.
• Connect an unlimited number of Portfolios and see your total in one currency
• Be alerted to new Warning Signs or Risks via email or mobile
• Track the Fair Value of your stocks
Have feedback on this article? Concerned about the content? Get in touch with us directly. Alternatively, email editorial-team (at) simplywallst.com.
This article by Simply Wall St is general in nature. We provide commentary based on historical data and analyst forecasts only using an unbiased methodology and our articles are not intended to be financial advice. It does not constitute a recommendation to buy or sell any stock, and does not take account of your objectives, or your financial situation. We aim to bring you long-term focused analysis driven by fundamental data. Note that our analysis may not factor in the latest price-sensitive company announcements or qualitative material. Simply Wall St has no position in any stocks mentioned.
About SHSE:603017
ARTS Group
Operates in the engineering technology service industry in China and internationally.
Excellent balance sheet with reasonable growth potential and pays a dividend.
Market Insights

Advertisement
Community Narratives
Quality at a Premium. A time to watch, not to buy?
Fair Value US$154.56|29.3% undervalued
DA
Community Contributor
GRAB: The Super-App at the Heart of Southeast Asia’s Digital Boom
Fair Value US$6.60|7.0% undervalued
BL
Community Contributor
Verve Group to Surge with 51.61% Revenue Growth
Fair Value €6.00|65.0% undervalued
ME
Community Contributor