- China
- /
- Commercial Services
- /
- SHSE:600836
Shanghai Eliansy Industry Group's (SHSE:600836) Returns On Capital Not Reflecting Well On The Business


When it comes to investing, there are some useful financial metrics that can warn us when a business is potentially in trouble. When we see a declining return on capital employed (ROCE) in conjunction with a declining base of capital employed, that's often how a mature business shows signs of aging. Basically the company is earning less on its investments and it is also reducing its total assets. So after glancing at the trends within Shanghai Eliansy Industry Group (SHSE:600836), we weren't too hopeful.
Return On Capital Employed (ROCE): What Is It?
For those who don't know, ROCE is a measure of a company's yearly pre-tax profit (its return), relative to the capital employed in the business. To calculate this metric for Shanghai Eliansy Industry Group, this is the formula:
Return on Capital Employed = Earnings Before Interest and Tax (EBIT) ÷ (Total Assets - Current Liabilities)
0.019 = CN¥23m ÷ (CN¥2.0b - CN¥780m) (Based on the trailing twelve months to September 2023).
Thus, Shanghai Eliansy Industry Group has an ROCE of 1.9%. In absolute terms, that's a low return and it also under-performs the Commercial Services industry average of 5.7%.
See our latest analysis for Shanghai Eliansy Industry Group
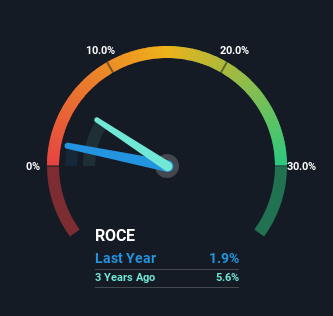
Historical performance is a great place to start when researching a stock so above you can see the gauge for Shanghai Eliansy Industry Group's ROCE against it's prior returns. If you want to delve into the historical earnings , check out these free graphs detailing revenue and cash flow performance of Shanghai Eliansy Industry Group.
So How Is Shanghai Eliansy Industry Group's ROCE Trending?
In terms of Shanghai Eliansy Industry Group's historical ROCE movements, the trend doesn't inspire confidence. About five years ago, returns on capital were 3.2%, however they're now substantially lower than that as we saw above. On top of that, it's worth noting that the amount of capital employed within the business has remained relatively steady. This combination can be indicative of a mature business that still has areas to deploy capital, but the returns received aren't as high due potentially to new competition or smaller margins. So because these trends aren't typically conducive to creating a multi-bagger, we wouldn't hold our breath on Shanghai Eliansy Industry Group becoming one if things continue as they have.
On a side note, Shanghai Eliansy Industry Group has done well to pay down its current liabilities to 40% of total assets. That could partly explain why the ROCE has dropped. What's more, this can reduce some aspects of risk to the business because now the company's suppliers or short-term creditors are funding less of its operations. Some would claim this reduces the business' efficiency at generating ROCE since it is now funding more of the operations with its own money.
The Key Takeaway
All in all, the lower returns from the same amount of capital employed aren't exactly signs of a compounding machine. It should come as no surprise then that the stock has fallen 50% over the last five years, so it looks like investors are recognizing these changes. Unless there is a shift to a more positive trajectory in these metrics, we would look elsewhere.
One more thing, we've spotted 2 warning signs facing Shanghai Eliansy Industry Group that you might find interesting.
If you want to search for solid companies with great earnings, check out this free list of companies with good balance sheets and impressive returns on equity.
If you're looking to trade Shanghai Eliansy Industry Group, open an account with the lowest-cost platform trusted by professionals, Interactive Brokers.
With clients in over 200 countries and territories, and access to 160 markets, IBKR lets you trade stocks, options, futures, forex, bonds and funds from a single integrated account.
Enjoy no hidden fees, no account minimums, and FX conversion rates as low as 0.03%, far better than what most brokers offer.
Sponsored ContentNew: Manage All Your Stock Portfolios in One Place
We've created the ultimate portfolio companion for stock investors, and it's free.
• Connect an unlimited number of Portfolios and see your total in one currency
• Be alerted to new Warning Signs or Risks via email or mobile
• Track the Fair Value of your stocks
Have feedback on this article? Concerned about the content? Get in touch with us directly. Alternatively, email editorial-team (at) simplywallst.com.
This article by Simply Wall St is general in nature. We provide commentary based on historical data and analyst forecasts only using an unbiased methodology and our articles are not intended to be financial advice. It does not constitute a recommendation to buy or sell any stock, and does not take account of your objectives, or your financial situation. We aim to bring you long-term focused analysis driven by fundamental data. Note that our analysis may not factor in the latest price-sensitive company announcements or qualitative material. Simply Wall St has no position in any stocks mentioned.
About SHSE:600836
Shanghai Eliansy Industry Group
Engages in packaging printing business in China and internationally.
Adequate balance sheet low.
Market Insights

Community Narratives


