
Advertisement
Here's What's Concerning About Xiamen Jiarong TechnologyLtd's (SZSE:301148) Returns On Capital
If we want to find a stock that could multiply over the long term, what are the underlying trends we should look for? Amongst other things, we'll want to see two things; firstly, a growing return on capital employed (ROCE) and secondly, an expansion in the company's amount of capital employed. Basically this means that a company has profitable initiatives that it can continue to reinvest in, which is a trait of a compounding machine. In light of that, when we looked at Xiamen Jiarong TechnologyLtd (SZSE:301148) and its ROCE trend, we weren't exactly thrilled.
Understanding Return On Capital Employed (ROCE)
Just to clarify if you're unsure, ROCE is a metric for evaluating how much pre-tax income (in percentage terms) a company earns on the capital invested in its business. Analysts use this formula to calculate it for Xiamen Jiarong TechnologyLtd:
Return on Capital Employed = Earnings Before Interest and Tax (EBIT) ÷ (Total Assets - Current Liabilities)
0.0029 = CN¥5.4m ÷ (CN¥2.2b - CN¥349m) (Based on the trailing twelve months to June 2024).
Therefore, Xiamen Jiarong TechnologyLtd has an ROCE of 0.3%. Ultimately, that's a low return and it under-performs the Machinery industry average of 5.5%.
See our latest analysis for Xiamen Jiarong TechnologyLtd
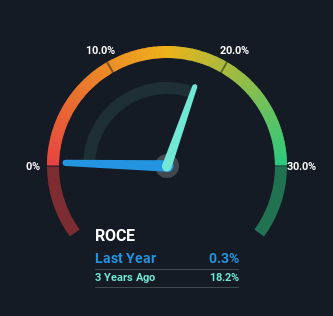
Historical performance is a great place to start when researching a stock so above you can see the gauge for Xiamen Jiarong TechnologyLtd's ROCE against it's prior returns. If you'd like to look at how Xiamen Jiarong TechnologyLtd has performed in the past in other metrics, you can view this free graph of Xiamen Jiarong TechnologyLtd's past earnings, revenue and cash flow.
What Can We Tell From Xiamen Jiarong TechnologyLtd's ROCE Trend?
In terms of Xiamen Jiarong TechnologyLtd's historical ROCE movements, the trend isn't fantastic. Around five years ago the returns on capital were 58%, but since then they've fallen to 0.3%. And considering revenue has dropped while employing more capital, we'd be cautious. This could mean that the business is losing its competitive advantage or market share, because while more money is being put into ventures, it's actually producing a lower return - "less bang for their buck" per se.
On a related note, Xiamen Jiarong TechnologyLtd has decreased its current liabilities to 16% of total assets. So we could link some of this to the decrease in ROCE. Effectively this means their suppliers or short-term creditors are funding less of the business, which reduces some elements of risk. Some would claim this reduces the business' efficiency at generating ROCE since it is now funding more of the operations with its own money.
The Bottom Line On Xiamen Jiarong TechnologyLtd's ROCE
From the above analysis, we find it rather worrisome that returns on capital and sales for Xiamen Jiarong TechnologyLtd have fallen, meanwhile the business is employing more capital than it was five years ago. Long term shareholders who've owned the stock over the last year have experienced a 26% depreciation in their investment, so it appears the market might not like these trends either. Unless there is a shift to a more positive trajectory in these metrics, we would look elsewhere.
Xiamen Jiarong TechnologyLtd does have some risks, we noticed 4 warning signs (and 2 which make us uncomfortable) we think you should know about.
While Xiamen Jiarong TechnologyLtd may not currently earn the highest returns, we've compiled a list of companies that currently earn more than 25% return on equity. Check out this free list here.
New: AI Stock Screener & Alerts
Our new AI Stock Screener scans the market every day to uncover opportunities.
• Dividend Powerhouses (3%+ Yield)
• Undervalued Small Caps with Insider Buying
• High growth Tech and AI Companies
Or build your own from over 50 metrics.
Have feedback on this article? Concerned about the content? Get in touch with us directly. Alternatively, email editorial-team (at) simplywallst.com.
This article by Simply Wall St is general in nature. We provide commentary based on historical data and analyst forecasts only using an unbiased methodology and our articles are not intended to be financial advice. It does not constitute a recommendation to buy or sell any stock, and does not take account of your objectives, or your financial situation. We aim to bring you long-term focused analysis driven by fundamental data. Note that our analysis may not factor in the latest price-sensitive company announcements or qualitative material. Simply Wall St has no position in any stocks mentioned.
About SZSE:301148
Xiamen Jiarong TechnologyLtd
Manufactures and sells environmental protection equipment.
Flawless balance sheet with acceptable track record.
Similar Companies
Market Insights


Advertisement
Community Narratives
100% Patient Improvement in trial puts this $16M Biotech on the radar
Fair Value US$5.30|72.3% undervalued
JO
Community Contributor
Exxon Mobil's 17.5% Upside Promises Industry-Leading Returns in Energy Transition
Fair Value US$132.00|16.8% undervalued
HE
Community Contributor
NHC Analysis: Quality at a Good Price. A Golden Opportunity?
Fair Value US$179.80|35.5% undervalued
DA
Community Contributor
New Product Lines And Store Expansion Will Fuel Global Momentum
Fair Value US$270.82|37.9% undervalued
AN
Based on Analyst Price Targets