
Advertisement
- China
- /
- Aerospace & Defense
- /
- SZSE:301050
Chengdu RML Technology's (SZSE:301050) Solid Earnings Are Supported By Other Strong Factors

When companies post strong earnings, the stock generally performs well, just like Chengdu RML Technology Co., Ltd.'s (SZSE:301050) stock has recently. Our analysis found some more factors that we think are good for shareholders.
View our latest analysis for Chengdu RML Technology
Examining Cashflow Against Chengdu RML Technology's Earnings
In high finance, the key ratio used to measure how well a company converts reported profits into free cash flow (FCF) is the accrual ratio (from cashflow). To get the accrual ratio we first subtract FCF from profit for a period, and then divide that number by the average operating assets for the period. This ratio tells us how much of a company's profit is not backed by free cashflow.
That means a negative accrual ratio is a good thing, because it shows that the company is bringing in more free cash flow than its profit would suggest. That is not intended to imply we should worry about a positive accrual ratio, but it's worth noting where the accrual ratio is rather high. To quote a 2014 paper by Lewellen and Resutek, "firms with higher accruals tend to be less profitable in the future".
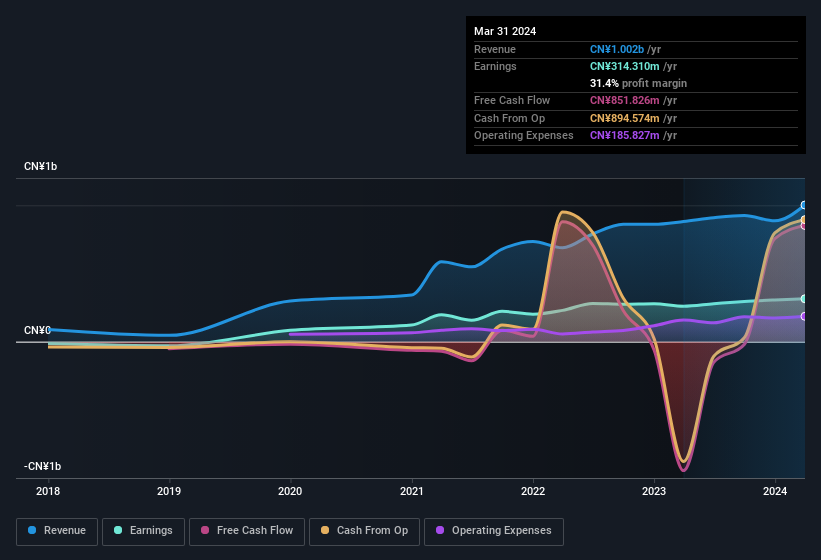
Over the twelve months to March 2024, Chengdu RML Technology recorded an accrual ratio of -0.60. That indicates that its free cash flow quite significantly exceeded its statutory profit. To wit, it produced free cash flow of CN¥852m during the period, dwarfing its reported profit of CN¥314.3m. Notably, Chengdu RML Technology had negative free cash flow last year, so the CN¥852m it produced this year was a welcome improvement. However, that's not all there is to consider. We can see that unusual items have impacted its statutory profit, and therefore the accrual ratio.
That might leave you wondering what analysts are forecasting in terms of future profitability. Luckily, you can click here to see an interactive graph depicting future profitability, based on their estimates.
The Impact Of Unusual Items On Profit
Surprisingly, given Chengdu RML Technology's accrual ratio implied strong cash conversion, its paper profit was actually boosted by CN¥23m in unusual items. While we like to see profit increases, we tend to be a little more cautious when unusual items have made a big contribution. When we crunched the numbers on thousands of publicly listed companies, we found that a boost from unusual items in a given year is often not repeated the next year. And that's as you'd expect, given these boosts are described as 'unusual'. Assuming those unusual items don't show up again in the current year, we'd thus expect profit to be weaker next year (in the absence of business growth, that is).
Our Take On Chengdu RML Technology's Profit Performance
Chengdu RML Technology's profits got a boost from unusual items, which indicates they might not be sustained and yet its accrual ratio still indicated solid cash conversion, which is promising. Based on these factors, we think that Chengdu RML Technology's profits are a reasonably conservative guide to its underlying profitability. With this in mind, we wouldn't consider investing in a stock unless we had a thorough understanding of the risks. For example, we've discovered 1 warning sign that you should run your eye over to get a better picture of Chengdu RML Technology.
In this article we've looked at a number of factors that can impair the utility of profit numbers, as a guide to a business. But there is always more to discover if you are capable of focussing your mind on minutiae. Some people consider a high return on equity to be a good sign of a quality business. So you may wish to see this free collection of companies boasting high return on equity, or this list of stocks that insiders are buying.
New: AI Stock Screener & Alerts
Our new AI Stock Screener scans the market every day to uncover opportunities.
• Dividend Powerhouses (3%+ Yield)
• Undervalued Small Caps with Insider Buying
• High growth Tech and AI Companies
Or build your own from over 50 metrics.
Have feedback on this article? Concerned about the content? Get in touch with us directly. Alternatively, email editorial-team (at) simplywallst.com.
This article by Simply Wall St is general in nature. We provide commentary based on historical data and analyst forecasts only using an unbiased methodology and our articles are not intended to be financial advice. It does not constitute a recommendation to buy or sell any stock, and does not take account of your objectives, or your financial situation. We aim to bring you long-term focused analysis driven by fundamental data. Note that our analysis may not factor in the latest price-sensitive company announcements or qualitative material. Simply Wall St has no position in any stocks mentioned.
About SZSE:301050
Chengdu RML Technology
Engages in the research, development, manufacturing, testing, and sale of millimeter-wave microsystems.
Flawless balance sheet with reasonable growth potential.
Market Insights

Advertisement
Community Narratives
Vita Life Sciences Set for a 12.72% Revenue Growth While Tackling Operational Challenges
Fair Value AU$2.42|8.7% undervalued
RO
Community Contributor
Vossloh rides a €500 billion wave to boost growth and earnings in the next decade
Fair Value €78.41|6.3% undervalued
CH
Community Contributor
Intuitive Surgical Will Transform Healthcare with 12% Revenue Growth
Fair Value US$325.55|56.5% overvalued
UN
Community Contributor