
Advertisement
Why Investors Shouldn't Be Surprised By Chengdu Dahongli Machinery Co.,Ltd.'s (SZSE:300865) 26% Share Price Plunge

To the annoyance of some shareholders, Chengdu Dahongli Machinery Co.,Ltd. (SZSE:300865) shares are down a considerable 26% in the last month, which continues a horrid run for the company. Instead of being rewarded, shareholders who have already held through the last twelve months are now sitting on a 46% share price drop.
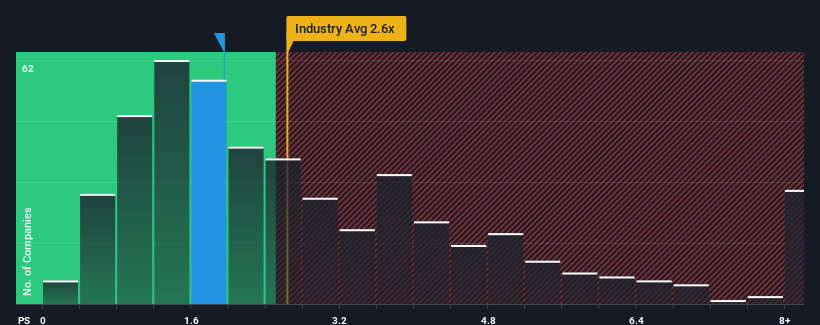
After such a large drop in price, Chengdu Dahongli MachineryLtd's price-to-sales (or "P/S") ratio of 2x might make it look like a buy right now compared to the Machinery industry in China, where around half of the companies have P/S ratios above 2.6x and even P/S above 5x are quite common. Although, it's not wise to just take the P/S at face value as there may be an explanation why it's limited.
See our latest analysis for Chengdu Dahongli MachineryLtd
What Does Chengdu Dahongli MachineryLtd's Recent Performance Look Like?
Chengdu Dahongli MachineryLtd has been doing a good job lately as it's been growing revenue at a solid pace. One possibility is that the P/S is low because investors think this respectable revenue growth might actually underperform the broader industry in the near future. If you like the company, you'd be hoping this isn't the case so that you could potentially pick up some stock while it's out of favour.
We don't have analyst forecasts, but you can see how recent trends are setting up the company for the future by checking out our free report on Chengdu Dahongli MachineryLtd's earnings, revenue and cash flow.Do Revenue Forecasts Match The Low P/S Ratio?
The only time you'd be truly comfortable seeing a P/S as low as Chengdu Dahongli MachineryLtd's is when the company's growth is on track to lag the industry.
If we review the last year of revenue growth, the company posted a worthy increase of 9.3%. However, this wasn't enough as the latest three year period has seen an unpleasant 10% overall drop in revenue. Accordingly, shareholders would have felt downbeat about the medium-term rates of revenue growth.
Weighing that medium-term revenue trajectory against the broader industry's one-year forecast for expansion of 24% shows it's an unpleasant look.
With this information, we are not surprised that Chengdu Dahongli MachineryLtd is trading at a P/S lower than the industry. Nonetheless, there's no guarantee the P/S has reached a floor yet with revenue going in reverse. There's potential for the P/S to fall to even lower levels if the company doesn't improve its top-line growth.
The Final Word
Chengdu Dahongli MachineryLtd's P/S has taken a dip along with its share price. Generally, our preference is to limit the use of the price-to-sales ratio to establishing what the market thinks about the overall health of a company.
As we suspected, our examination of Chengdu Dahongli MachineryLtd revealed its shrinking revenue over the medium-term is contributing to its low P/S, given the industry is set to grow. Right now shareholders are accepting the low P/S as they concede future revenue probably won't provide any pleasant surprises either. Unless the recent medium-term conditions improve, they will continue to form a barrier for the share price around these levels.
Don't forget that there may be other risks. For instance, we've identified 2 warning signs for Chengdu Dahongli MachineryLtd that you should be aware of.
If you're unsure about the strength of Chengdu Dahongli MachineryLtd's business, why not explore our interactive list of stocks with solid business fundamentals for some other companies you may have missed.
New: AI Stock Screener & Alerts
Our new AI Stock Screener scans the market every day to uncover opportunities.
• Dividend Powerhouses (3%+ Yield)
• Undervalued Small Caps with Insider Buying
• High growth Tech and AI Companies
Or build your own from over 50 metrics.
Have feedback on this article? Concerned about the content? Get in touch with us directly. Alternatively, email editorial-team (at) simplywallst.com.
This article by Simply Wall St is general in nature. We provide commentary based on historical data and analyst forecasts only using an unbiased methodology and our articles are not intended to be financial advice. It does not constitute a recommendation to buy or sell any stock, and does not take account of your objectives, or your financial situation. We aim to bring you long-term focused analysis driven by fundamental data. Note that our analysis may not factor in the latest price-sensitive company announcements or qualitative material. Simply Wall St has no position in any stocks mentioned.
About SZSE:300865
Chengdu Dahongli MachineryLtd
Manufactures and sells sand, gravel, and mining equipment in China and internationally.
Flawless balance sheet very low.
Market Insights

Advertisement
Community Narratives
Groundbreaking therapies that could change the treatment landscape for PTSD, fibromyalgia, MS & Alzheimer’s
Fair Value US$6.20|86.9% undervalued
CM
Community Contributor
DigitalOcean Will Grow 14% by Embracing AI with Paperspace Acquisition
Fair Value US$50.00|42.8% undervalued
NE
Community Contributor
Viant Technology: A Rising AdTech Challenger in the AI-Powered CTV Market
Fair Value US$38.61|66.0% undervalued
BL
Community Contributor
Volvo will Accelerate Forward into Electric and Autonomous Leadership in Five Years
Fair Value SEK 438.80|40.8% undervalued
UN
Community Contributor