
Advertisement
- China
- /
- Electrical
- /
- SZSE:300786
Qingdao Guolin Technology Group Co.,Ltd.'s (SZSE:300786) 35% Jump Shows Its Popularity With Investors
Qingdao Guolin Technology Group Co.,Ltd. (SZSE:300786) shareholders are no doubt pleased to see that the share price has bounced 35% in the last month, although it is still struggling to make up recently lost ground. Not all shareholders will be feeling jubilant, since the share price is still down a very disappointing 24% in the last twelve months.
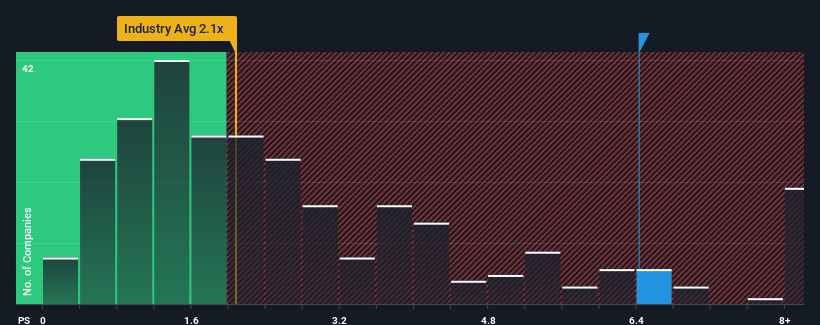
Following the firm bounce in price, you could be forgiven for thinking Qingdao Guolin Technology GroupLtd is a stock to steer clear of with a price-to-sales ratios (or "P/S") of 6.4x, considering almost half the companies in China's Electrical industry have P/S ratios below 2.1x. However, the P/S might be quite high for a reason and it requires further investigation to determine if it's justified.
View our latest analysis for Qingdao Guolin Technology GroupLtd
What Does Qingdao Guolin Technology GroupLtd's P/S Mean For Shareholders?
With revenue growth that's inferior to most other companies of late, Qingdao Guolin Technology GroupLtd has been relatively sluggish. Perhaps the market is expecting future revenue performance to undergo a reversal of fortunes, which has elevated the P/S ratio. If not, then existing shareholders may be very nervous about the viability of the share price.
If you'd like to see what analysts are forecasting going forward, you should check out our free report on Qingdao Guolin Technology GroupLtd.How Is Qingdao Guolin Technology GroupLtd's Revenue Growth Trending?
The only time you'd be truly comfortable seeing a P/S as steep as Qingdao Guolin Technology GroupLtd's is when the company's growth is on track to outshine the industry decidedly.
If we review the last year of revenue growth, the company posted a worthy increase of 11%. However, due to its less than impressive performance prior to this period, revenue growth is practically non-existent over the last three years overall. So it appears to us that the company has had a mixed result in terms of growing revenue over that time.
Shifting to the future, estimates from the one analyst covering the company suggest revenue should grow by 119% over the next year. That's shaping up to be materially higher than the 26% growth forecast for the broader industry.
In light of this, it's understandable that Qingdao Guolin Technology GroupLtd's P/S sits above the majority of other companies. It seems most investors are expecting this strong future growth and are willing to pay more for the stock.
What Does Qingdao Guolin Technology GroupLtd's P/S Mean For Investors?
The strong share price surge has lead to Qingdao Guolin Technology GroupLtd's P/S soaring as well. Generally, our preference is to limit the use of the price-to-sales ratio to establishing what the market thinks about the overall health of a company.
Our look into Qingdao Guolin Technology GroupLtd shows that its P/S ratio remains high on the merit of its strong future revenues. It appears that shareholders are confident in the company's future revenues, which is propping up the P/S. Unless the analysts have really missed the mark, these strong revenue forecasts should keep the share price buoyant.
You need to take note of risks, for example - Qingdao Guolin Technology GroupLtd has 3 warning signs (and 1 which is significant) we think you should know about.
It's important to make sure you look for a great company, not just the first idea you come across. So if growing profitability aligns with your idea of a great company, take a peek at this free list of interesting companies with strong recent earnings growth (and a low P/E).
Valuation is complex, but we're here to simplify it.
Discover if Qingdao Guolin Technology GroupLtd might be undervalued or overvalued with our detailed analysis, featuring fair value estimates, potential risks, dividends, insider trades, and its financial condition.
Access Free AnalysisHave feedback on this article? Concerned about the content? Get in touch with us directly. Alternatively, email editorial-team (at) simplywallst.com.
This article by Simply Wall St is general in nature. We provide commentary based on historical data and analyst forecasts only using an unbiased methodology and our articles are not intended to be financial advice. It does not constitute a recommendation to buy or sell any stock, and does not take account of your objectives, or your financial situation. We aim to bring you long-term focused analysis driven by fundamental data. Note that our analysis may not factor in the latest price-sensitive company announcements or qualitative material. Simply Wall St has no position in any stocks mentioned.
About SZSE:300786
Qingdao Guolin Technology GroupLtd
Engages in the design and manufacture, installation, commissioning, operation, and maintenance of ozone equipment.
Mediocre balance sheet minimal.
Market Insights


Advertisement
Community Narratives
Pole position to benefit from GENIUS Act
Fair Value US$233.04|59.1% undervalued
CH
Community Contributor
IREN will transform from bitcoin miner to leader in AI infrastructure
Fair Value US$21.48|15.5% undervalued
KA
Community Contributor
Behind the Assay: XRF Scientific’s Role in Modern Mining Economics
Fair Value AU$2.10|0% overvalued
RO
Community Contributor