Guangdong SACA Precision Manufacturing Co., Ltd. (SZSE:300464) Held Back By Insufficient Growth Even After Shares Climb 33%


Guangdong SACA Precision Manufacturing Co., Ltd. (SZSE:300464) shareholders are no doubt pleased to see that the share price has bounced 33% in the last month, although it is still struggling to make up recently lost ground. Not all shareholders will be feeling jubilant, since the share price is still down a very disappointing 35% in the last twelve months.
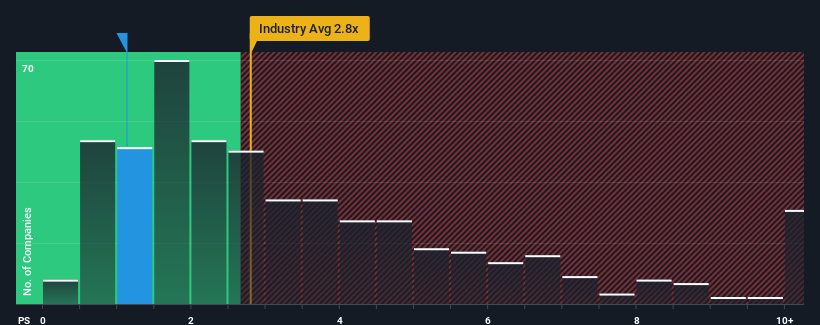
Although its price has surged higher, Guangdong SACA Precision Manufacturing may still be sending bullish signals at the moment with its price-to-sales (or "P/S") ratio of 1.1x, since almost half of all companies in the Machinery industry in China have P/S ratios greater than 2.8x and even P/S higher than 5x are not unusual. Nonetheless, we'd need to dig a little deeper to determine if there is a rational basis for the reduced P/S.
Check out our latest analysis for Guangdong SACA Precision Manufacturing
How Has Guangdong SACA Precision Manufacturing Performed Recently?
For example, consider that Guangdong SACA Precision Manufacturing's financial performance has been poor lately as its revenue has been in decline. It might be that many expect the disappointing revenue performance to continue or accelerate, which has repressed the P/S. Those who are bullish on Guangdong SACA Precision Manufacturing will be hoping that this isn't the case so that they can pick up the stock at a lower valuation.
We don't have analyst forecasts, but you can see how recent trends are setting up the company for the future by checking out our free report on Guangdong SACA Precision Manufacturing's earnings, revenue and cash flow.Do Revenue Forecasts Match The Low P/S Ratio?
The only time you'd be truly comfortable seeing a P/S as low as Guangdong SACA Precision Manufacturing's is when the company's growth is on track to lag the industry.
Retrospectively, the last year delivered a frustrating 29% decrease to the company's top line. As a result, revenue from three years ago have also fallen 62% overall. So unfortunately, we have to acknowledge that the company has not done a great job of growing revenue over that time.
Weighing that medium-term revenue trajectory against the broader industry's one-year forecast for expansion of 27% shows it's an unpleasant look.
With this information, we are not surprised that Guangdong SACA Precision Manufacturing is trading at a P/S lower than the industry. Nonetheless, there's no guarantee the P/S has reached a floor yet with revenue going in reverse. There's potential for the P/S to fall to even lower levels if the company doesn't improve its top-line growth.
The Key Takeaway
Despite Guangdong SACA Precision Manufacturing's share price climbing recently, its P/S still lags most other companies. It's argued the price-to-sales ratio is an inferior measure of value within certain industries, but it can be a powerful business sentiment indicator.
As we suspected, our examination of Guangdong SACA Precision Manufacturing revealed its shrinking revenue over the medium-term is contributing to its low P/S, given the industry is set to grow. At this stage investors feel the potential for an improvement in revenue isn't great enough to justify a higher P/S ratio. If recent medium-term revenue trends continue, it's hard to see the share price moving strongly in either direction in the near future under these circumstances.
It's always necessary to consider the ever-present spectre of investment risk. We've identified 2 warning signs with Guangdong SACA Precision Manufacturing (at least 1 which is a bit unpleasant), and understanding these should be part of your investment process.
If strong companies turning a profit tickle your fancy, then you'll want to check out this free list of interesting companies that trade on a low P/E (but have proven they can grow earnings).
New: Manage All Your Stock Portfolios in One Place
We've created the ultimate portfolio companion for stock investors, and it's free.
• Connect an unlimited number of Portfolios and see your total in one currency
• Be alerted to new Warning Signs or Risks via email or mobile
• Track the Fair Value of your stocks
Have feedback on this article? Concerned about the content? Get in touch with us directly. Alternatively, email editorial-team (at) simplywallst.com.
This article by Simply Wall St is general in nature. We provide commentary based on historical data and analyst forecasts only using an unbiased methodology and our articles are not intended to be financial advice. It does not constitute a recommendation to buy or sell any stock, and does not take account of your objectives, or your financial situation. We aim to bring you long-term focused analysis driven by fundamental data. Note that our analysis may not factor in the latest price-sensitive company announcements or qualitative material. Simply Wall St has no position in any stocks mentioned.
About SZSE:300464
Guangdong SACA Precision Manufacturing
Engages in the research, development, design, and sale of consumer electronic products in China and internationally.
Mediocre balance sheet and slightly overvalued.

