
Advertisement
- China
- /
- General Merchandise and Department Stores
- /
- SHSE:600824
The Returns On Capital At Shanghai Yimin Commercial Group (SHSE:600824) Don't Inspire Confidence
When researching a stock for investment, what can tell us that the company is in decline? More often than not, we'll see a declining return on capital employed (ROCE) and a declining amount of capital employed. Trends like this ultimately mean the business is reducing its investments and also earning less on what it has invested. Having said that, after a brief look, Shanghai Yimin Commercial Group (SHSE:600824) we aren't filled with optimism, but let's investigate further.
Understanding Return On Capital Employed (ROCE)
For those who don't know, ROCE is a measure of a company's yearly pre-tax profit (its return), relative to the capital employed in the business. The formula for this calculation on Shanghai Yimin Commercial Group is:
Return on Capital Employed = Earnings Before Interest and Tax (EBIT) ÷ (Total Assets - Current Liabilities)
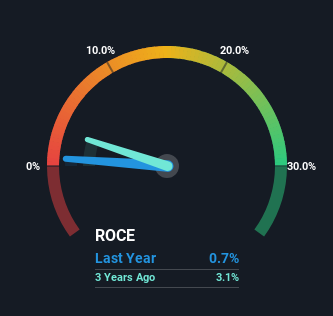
0.0068 = CN¥17m ÷ (CN¥2.8b - CN¥301m) (Based on the trailing twelve months to September 2024).
So, Shanghai Yimin Commercial Group has an ROCE of 0.7%. In absolute terms, that's a low return and it also under-performs the Multiline Retail industry average of 3.9%.
View our latest analysis for Shanghai Yimin Commercial Group
While the past is not representative of the future, it can be helpful to know how a company has performed historically, which is why we have this chart above. If you'd like to look at how Shanghai Yimin Commercial Group has performed in the past in other metrics, you can view this free graph of Shanghai Yimin Commercial Group's past earnings, revenue and cash flow.
What The Trend Of ROCE Can Tell Us
There is reason to be cautious about Shanghai Yimin Commercial Group, given the returns are trending downwards. About five years ago, returns on capital were 5.0%, however they're now substantially lower than that as we saw above. And on the capital employed front, the business is utilizing roughly the same amount of capital as it was back then. This combination can be indicative of a mature business that still has areas to deploy capital, but the returns received aren't as high due potentially to new competition or smaller margins. If these trends continue, we wouldn't expect Shanghai Yimin Commercial Group to turn into a multi-bagger.
The Bottom Line On Shanghai Yimin Commercial Group's ROCE
In summary, it's unfortunate that Shanghai Yimin Commercial Group is generating lower returns from the same amount of capital. Yet despite these concerning fundamentals, the stock has performed strongly with a 47% return over the last five years, so investors appear very optimistic. In any case, the current underlying trends don't bode well for long term performance so unless they reverse, we'd start looking elsewhere.
If you'd like to know more about Shanghai Yimin Commercial Group, we've spotted 3 warning signs, and 1 of them shouldn't be ignored.
While Shanghai Yimin Commercial Group may not currently earn the highest returns, we've compiled a list of companies that currently earn more than 25% return on equity. Check out this free list here.
New: Manage All Your Stock Portfolios in One Place
We've created the ultimate portfolio companion for stock investors, and it's free.
• Connect an unlimited number of Portfolios and see your total in one currency
• Be alerted to new Warning Signs or Risks via email or mobile
• Track the Fair Value of your stocks
Have feedback on this article? Concerned about the content? Get in touch with us directly. Alternatively, email editorial-team (at) simplywallst.com.
This article by Simply Wall St is general in nature. We provide commentary based on historical data and analyst forecasts only using an unbiased methodology and our articles are not intended to be financial advice. It does not constitute a recommendation to buy or sell any stock, and does not take account of your objectives, or your financial situation. We aim to bring you long-term focused analysis driven by fundamental data. Note that our analysis may not factor in the latest price-sensitive company announcements or qualitative material. Simply Wall St has no position in any stocks mentioned.
About SHSE:600824
Shanghai Yimin Commercial Group
Shanghai Yimin Commercial Group Co., Ltd.
Flawless balance sheet with acceptable track record.
Market Insights

Advertisement
Community Narratives
MINISO's fair value is projected at 26.69 with an anticipated PE ratio shift of 20x
Fair Value US$24.03|11.4% undervalued
BE
Community Contributor
Procter & Gamble: A Dividend Giant Facing Slowing Growth
Fair Value US$119.81|23.5% overvalued
AN
Community Contributor
Eli Lilly's Future Growth Driven by Tirzepatide and Favorable Market Conditions
Fair Value US$1.19k|14.0% undervalued
EA
Community Contributor