- China
- /
- Electrical
- /
- SZSE:300032
Jinlong Machinery & Electronic Co.,Ltd (SZSE:300032) Stock's 25% Dive Might Signal An Opportunity But It Requires Some Scrutiny


The Jinlong Machinery & Electronic Co.,Ltd (SZSE:300032) share price has fared very poorly over the last month, falling by a substantial 25%. The drop over the last 30 days has capped off a tough year for shareholders, with the share price down 42% in that time.
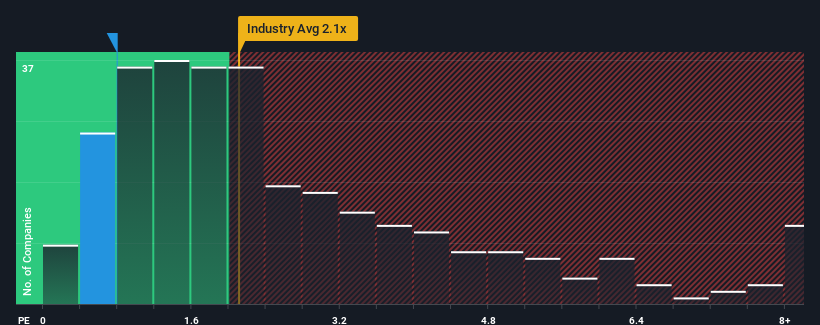
In spite of the heavy fall in price, given about half the companies operating in China's Electrical industry have price-to-sales ratios (or "P/S") above 2.1x, you may still consider Jinlong Machinery & ElectronicLtd as an attractive investment with its 0.8x P/S ratio. Nonetheless, we'd need to dig a little deeper to determine if there is a rational basis for the reduced P/S.
See our latest analysis for Jinlong Machinery & ElectronicLtd
How Jinlong Machinery & ElectronicLtd Has Been Performing
Jinlong Machinery & ElectronicLtd has been doing a decent job lately as it's been growing revenue at a reasonable pace. Perhaps the market believes the recent revenue performance might fall short of industry figures in the near future, leading to a reduced P/S. If you like the company, you'd be hoping this isn't the case so that you could potentially pick up some stock while it's out of favour.
Although there are no analyst estimates available for Jinlong Machinery & ElectronicLtd, take a look at this free data-rich visualisation to see how the company stacks up on earnings, revenue and cash flow.How Is Jinlong Machinery & ElectronicLtd's Revenue Growth Trending?
Jinlong Machinery & ElectronicLtd's P/S ratio would be typical for a company that's only expected to deliver limited growth, and importantly, perform worse than the industry.
If we review the last year of revenue growth, the company posted a worthy increase of 5.1%. This was backed up an excellent period prior to see revenue up by 118% in total over the last three years. Therefore, it's fair to say the revenue growth recently has been superb for the company.
When compared to the industry's one-year growth forecast of 23%, the most recent medium-term revenue trajectory is noticeably more alluring
With this in mind, we find it intriguing that Jinlong Machinery & ElectronicLtd's P/S isn't as high compared to that of its industry peers. It looks like most investors are not convinced the company can maintain its recent growth rates.
The Key Takeaway
The southerly movements of Jinlong Machinery & ElectronicLtd's shares means its P/S is now sitting at a pretty low level. Typically, we'd caution against reading too much into price-to-sales ratios when settling on investment decisions, though it can reveal plenty about what other market participants think about the company.
Our examination of Jinlong Machinery & ElectronicLtd revealed its three-year revenue trends aren't boosting its P/S anywhere near as much as we would have predicted, given they look better than current industry expectations. When we see strong revenue with faster-than-industry growth, we assume there are some significant underlying risks to the company's ability to make money which is applying downwards pressure on the P/S ratio. While recent revenue trends over the past medium-term suggest that the risk of a price decline is low, investors appear to perceive a likelihood of revenue fluctuations in the future.
Plus, you should also learn about these 2 warning signs we've spotted with Jinlong Machinery & ElectronicLtd.
If companies with solid past earnings growth is up your alley, you may wish to see this free collection of other companies with strong earnings growth and low P/E ratios.
New: Manage All Your Stock Portfolios in One Place
We've created the ultimate portfolio companion for stock investors, and it's free.
• Connect an unlimited number of Portfolios and see your total in one currency
• Be alerted to new Warning Signs or Risks via email or mobile
• Track the Fair Value of your stocks
Have feedback on this article? Concerned about the content? Get in touch with us directly. Alternatively, email editorial-team (at) simplywallst.com.
This article by Simply Wall St is general in nature. We provide commentary based on historical data and analyst forecasts only using an unbiased methodology and our articles are not intended to be financial advice. It does not constitute a recommendation to buy or sell any stock, and does not take account of your objectives, or your financial situation. We aim to bring you long-term focused analysis driven by fundamental data. Note that our analysis may not factor in the latest price-sensitive company announcements or qualitative material. Simply Wall St has no position in any stocks mentioned.
About SZSE:300032
Jinlong Machinery & ElectronicLtd
Researches, produces, and sells motors in China and internationally.
Excellent balance sheet and overvalued.
Market Insights

Community Narratives
