- China
- /
- Construction
- /
- SZSE:002929
Here's What To Make Of Runjian's (SZSE:002929) Decelerating Rates Of Return


To find a multi-bagger stock, what are the underlying trends we should look for in a business? Amongst other things, we'll want to see two things; firstly, a growing return on capital employed (ROCE) and secondly, an expansion in the company's amount of capital employed. If you see this, it typically means it's a company with a great business model and plenty of profitable reinvestment opportunities. However, after investigating Runjian (SZSE:002929), we don't think it's current trends fit the mold of a multi-bagger.
Understanding Return On Capital Employed (ROCE)
For those who don't know, ROCE is a measure of a company's yearly pre-tax profit (its return), relative to the capital employed in the business. Analysts use this formula to calculate it for Runjian:
Return on Capital Employed = Earnings Before Interest and Tax (EBIT) ÷ (Total Assets - Current Liabilities)
0.079 = CN¥491m ÷ (CN¥15b - CN¥8.4b) (Based on the trailing twelve months to March 2024).
Therefore, Runjian has an ROCE of 7.9%. On its own that's a low return, but compared to the average of 6.5% generated by the Construction industry, it's much better.
Check out our latest analysis for Runjian
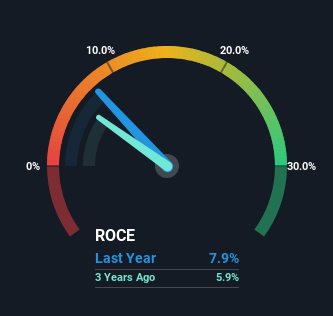
Above you can see how the current ROCE for Runjian compares to its prior returns on capital, but there's only so much you can tell from the past. If you'd like to see what analysts are forecasting going forward, you should check out our free analyst report for Runjian .
What Can We Tell From Runjian's ROCE Trend?
The returns on capital haven't changed much for Runjian in recent years. Over the past five years, ROCE has remained relatively flat at around 7.9% and the business has deployed 132% more capital into its operations. Given the company has increased the amount of capital employed, it appears the investments that have been made simply don't provide a high return on capital.
On another note, while the change in ROCE trend might not scream for attention, it's interesting that the current liabilities have actually gone up over the last five years. This is intriguing because if current liabilities hadn't increased to 57% of total assets, this reported ROCE would probably be less than7.9% because total capital employed would be higher.The 7.9% ROCE could be even lower if current liabilities weren't 57% of total assets, because the the formula would show a larger base of total capital employed. So with current liabilities at such high levels, this effectively means the likes of suppliers or short-term creditors are funding a meaningful part of the business, which in some instances can bring some risks.
The Key Takeaway
In conclusion, Runjian has been investing more capital into the business, but returns on that capital haven't increased. Additionally, the stock's total return to shareholders over the last five years has been flat, which isn't too surprising. All in all, the inherent trends aren't typical of multi-baggers, so if that's what you're after, we think you might have more luck elsewhere.
On a final note, we've found 2 warning signs for Runjian that we think you should be aware of.
While Runjian may not currently earn the highest returns, we've compiled a list of companies that currently earn more than 25% return on equity. Check out this free list here.
If you're looking to trade Runjian, open an account with the lowest-cost platform trusted by professionals, Interactive Brokers.
With clients in over 200 countries and territories, and access to 160 markets, IBKR lets you trade stocks, options, futures, forex, bonds and funds from a single integrated account.
Enjoy no hidden fees, no account minimums, and FX conversion rates as low as 0.03%, far better than what most brokers offer.
Sponsored ContentNew: AI Stock Screener & Alerts
Our new AI Stock Screener scans the market every day to uncover opportunities.
• Dividend Powerhouses (3%+ Yield)
• Undervalued Small Caps with Insider Buying
• High growth Tech and AI Companies
Or build your own from over 50 metrics.
Have feedback on this article? Concerned about the content? Get in touch with us directly. Alternatively, email editorial-team (at) simplywallst.com.
This article by Simply Wall St is general in nature. We provide commentary based on historical data and analyst forecasts only using an unbiased methodology and our articles are not intended to be financial advice. It does not constitute a recommendation to buy or sell any stock, and does not take account of your objectives, or your financial situation. We aim to bring you long-term focused analysis driven by fundamental data. Note that our analysis may not factor in the latest price-sensitive company announcements or qualitative material. Simply Wall St has no position in any stocks mentioned.
About SZSE:002929
Runjian
A communication technology service company, engages in the communication network construction and maintenance business in China.
Reasonable growth potential slight.
Market Insights

Community Narratives

