
Advertisement

As global markets navigate a period marked by rate cuts from the ECB and SNB, and with expectations of a forthcoming Fed cut, small-cap stocks have faced challenges, particularly as the Russell 2000 Index underperformed against larger indices like the S&P 500. Despite these hurdles, opportunities may arise in overlooked sectors where unique business models or innovative approaches can capture growth potential amidst broader market volatility. In this context, identifying undiscovered gems requires a keen eye for companies that demonstrate resilience and adaptability in shifting economic landscapes.
Top 10 Undiscovered Gems With Strong Fundamentals
| Name | Debt To Equity | Revenue Growth | Earnings Growth | Health Rating |
|---|---|---|---|---|
| Nippon Denko | 20.08% | 5.07% | 47.43% | ★★★★★★ |
| Lelon Electronics | 20.09% | 6.53% | 15.44% | ★★★★★★ |
| Eagle Financial Services | 170.75% | 12.30% | 1.92% | ★★★★★★ |
| Franklin Financial Services | 173.21% | 5.55% | -1.86% | ★★★★★★ |
| AzureWave Technologies | NA | 3.00% | 29.49% | ★★★★★★ |
| Ovostar Union | 0.01% | 10.19% | 49.85% | ★★★★★★ |
| Tianyun International Holdings | 10.09% | -5.59% | -9.92% | ★★★★★★ |
| Advancetek EnterpriseLtd | 56.32% | 41.67% | 65.57% | ★★★★★☆ |
| Keli Motor Group | 21.66% | 9.99% | -12.19% | ★★★★★☆ |
| A2B Australia | 15.83% | -7.78% | 25.44% | ★★★★☆☆ |
We'll examine a selection from our screener results.
Tibet Development (SZSE:000752)
Simply Wall St Value Rating: ★★★★★★
Overview: Tibet Development Co., Ltd. focuses on the production and sale of beer in China, with a market capitalization of CN¥2.23 billion.
Operations: The primary revenue stream for Tibet Development Co., Ltd. is the sale of beer, generating CN¥389.61 million.
Tibet Development has shown promising strides, becoming profitable this year with a net income of CNY 23.99 million for the first nine months compared to a loss of CNY 53.37 million last year. The company's debt-to-equity ratio improved significantly from 84.3% to 51.5% over five years, highlighting better financial management. Sales climbed to CNY 299.46 million from CNY 245.88 million, suggesting strong revenue growth and high-quality earnings that surpass industry averages in profitability metrics like basic earnings per share at CNY 0.091 versus a previous loss of CNY 0.2 per share, reflecting robust business momentum moving forward.
Tianjin LVYIN Landscape and Ecology Construction (SZSE:002887)
Simply Wall St Value Rating: ★★★★☆☆
Overview: Tianjin LVYIN Landscape and Ecology Construction Co., Ltd is engaged in ecological restoration and landscaping construction in China, with a market cap of approximately CN¥2.46 billion.
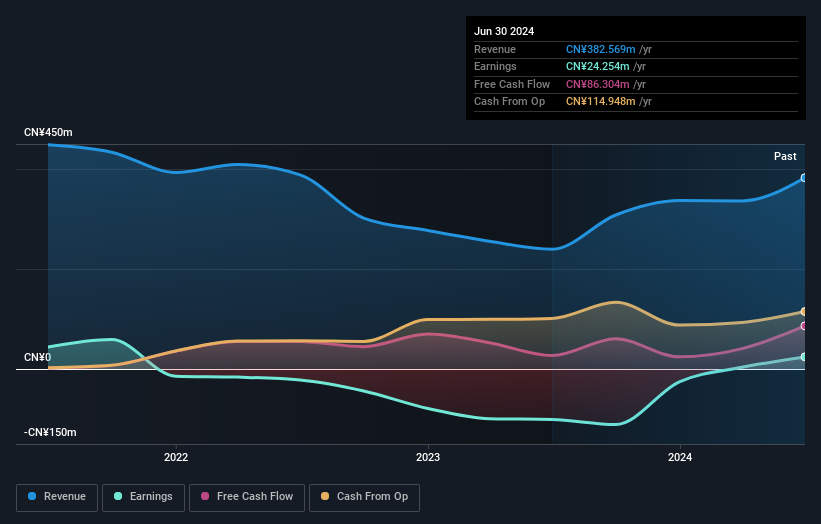
Operations: LVYIN Landscape and Ecology Construction generates revenue primarily from the construction industry, with reported earnings of CN¥398.29 million.
Tianjin LVYIN Landscape and Ecology Construction, a smaller player in its field, has demonstrated notable financial resilience. Despite a slight dip in sales to CN¥243.65 million from CN¥245.7 million year-on-year, its earnings growth of 14% outpaced the construction industry's -3.9%. The company enjoys a satisfactory net debt to equity ratio of 21%, indicating prudent financial management. However, recent results show net income at CN¥51.65 million compared to last year's CN¥76.82 million due to a significant one-off gain previously recorded as CN¥19.6M impacting past results, suggesting potential volatility ahead despite positive free cash flow trends this year with levered free cash flow reaching positive figures like CNY 174M by September 2024.
Tanseisha (TSE:9743)
Simply Wall St Value Rating: ★★★★★☆
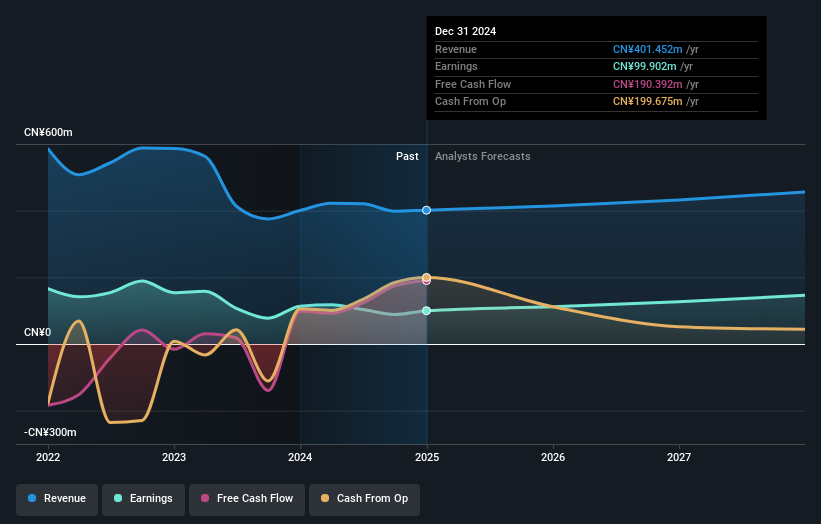
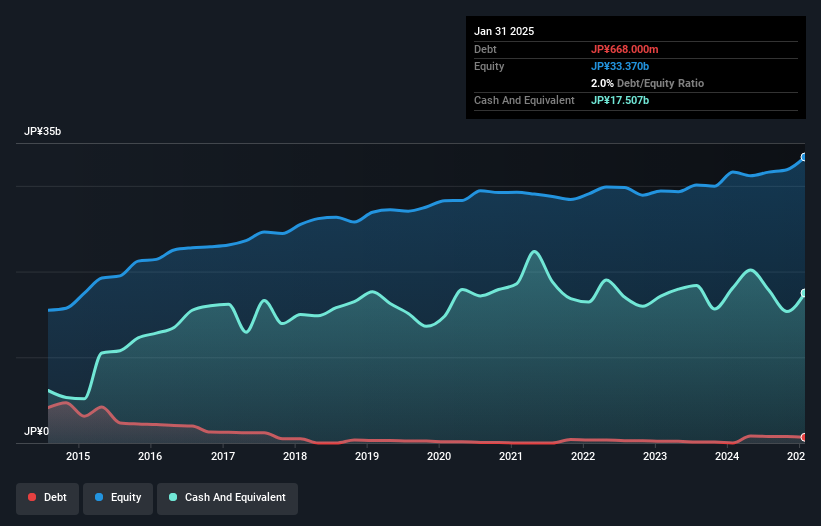
Overview: Tanseisha Co., Ltd. specializes in the research, planning, design, layout, production, construction, and operation of various spaces such as commercial and cultural venues both in Japan and internationally with a market cap of ¥39.08 billion.
Operations: Tanseisha generates revenue primarily from its involvement in the design, construction, and operation of various spaces. The company's cost structure includes expenses related to production and construction activities. Notably, Tanseisha's gross profit margin is a key financial metric to consider when evaluating its profitability.
Tanseisha, a notable player in the professional services sector, has shown impressive earnings growth of 156% over the past year, outpacing the industry's 8.3%. With a price-to-earnings ratio of 11.2x, it trades below Japan's market average of 13.5x, suggesting potential value for investors. Despite an increase in its debt-to-equity ratio from 0.8 to 2.4 over five years, Tanseisha holds more cash than total debt and covers interest payments comfortably. However, future earnings are projected to decrease by an average of 1.4% annually for three years ahead, hinting at potential challenges in sustaining this momentum.
- Get an in-depth perspective on Tanseisha's performance by reading our health report here.
Examine Tanseisha's past performance report to understand how it has performed in the past.
Next Steps
- Unlock more gems! Our Undiscovered Gems With Strong Fundamentals screener has unearthed 4623 more companies for you to explore.Click here to unveil our expertly curated list of 4626 Undiscovered Gems With Strong Fundamentals.
- Are you invested in these stocks already? Keep abreast of every twist and turn by setting up a portfolio with Simply Wall St, where we make it simple for investors like you to stay informed and proactive.
- Maximize your investment potential with Simply Wall St, the comprehensive app that offers global market insights for free.
Ready For A Different Approach?
- Explore high-performing small cap companies that haven't yet garnered significant analyst attention.
- Fuel your portfolio with companies showing strong growth potential, backed by optimistic outlooks both from analysts and management.
- Find companies with promising cash flow potential yet trading below their fair value.
This article by Simply Wall St is general in nature. We provide commentary based on historical data and analyst forecasts only using an unbiased methodology and our articles are not intended to be financial advice. It does not constitute a recommendation to buy or sell any stock, and does not take account of your objectives, or your financial situation. We aim to bring you long-term focused analysis driven by fundamental data. Note that our analysis may not factor in the latest price-sensitive company announcements or qualitative material. Simply Wall St has no position in any stocks mentioned.
Valuation is complex, but we're here to simplify it.
Discover if Tibet Development might be undervalued or overvalued with our detailed analysis, featuring fair value estimates, potential risks, dividends, insider trades, and its financial condition.
Access Free AnalysisHave feedback on this article? Concerned about the content? Get in touch with us directly. Alternatively, email editorial-team@simplywallst.com
About SZSE:000752
Flawless balance sheet with proven track record.
Market Insights

Advertisement
Community Narratives

Apple: A Dying Star with an Overpriced Valuation
Fair Value US$177.34|19.7% overvalued
IN
Community Contributor
Avino a case for USD$20 per share within 5 years (assuming $3,500 gold, $100 silver and $4 copper).
Fair Value CA$26.79|87.9% undervalued
AG
Community Contributor
Riding the Defense Boom RENK Sees Revenue Climb at 15% CAGR by FY 2029
Fair Value €69.87|24.5% undervalued
CH
Community Contributor