- China
- /
- Construction
- /
- SZSE:002811
Despite the downward trend in earnings at Shenzhen Cheng Chung Design (SZSE:002811) the stock spikes 12%, bringing five-year gains to 7.7%

While not a mind-blowing move, it is good to see that the Shenzhen Cheng Chung Design Co., Ltd. (SZSE:002811) share price has gained 22% in the last three months. But over the last half decade, the stock has not performed well. In fact, the share price is down 10%, which falls well short of the return you could get by buying an index fund.
On a more encouraging note the company has added CN¥267m to its market cap in just the last 7 days, so let's see if we can determine what's driven the five-year loss for shareholders.
Check out our latest analysis for Shenzhen Cheng Chung Design
To quote Buffett, 'Ships will sail around the world but the Flat Earth Society will flourish. There will continue to be wide discrepancies between price and value in the marketplace...' One imperfect but simple way to consider how the market perception of a company has shifted is to compare the change in the earnings per share (EPS) with the share price movement.
Shenzhen Cheng Chung Design became profitable within the last five years. Most would consider that to be a good thing, so it's counter-intuitive to see the share price declining. Other metrics may better explain the share price move.
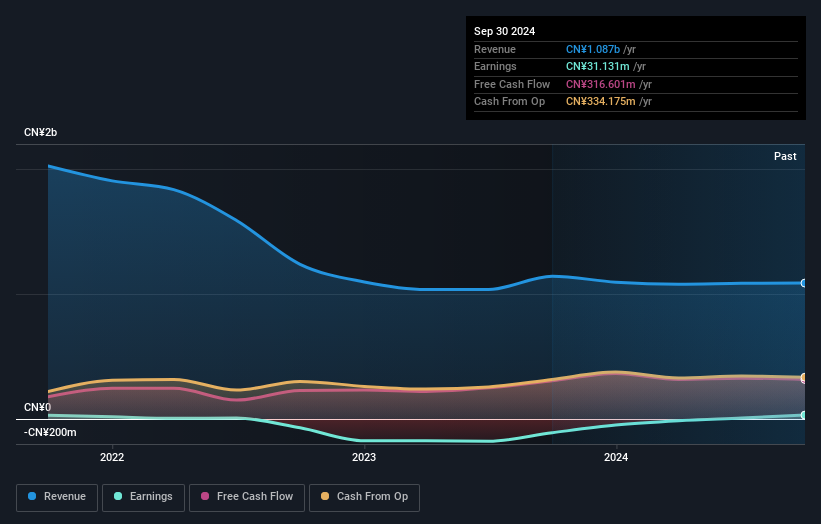
We note that the dividend has fallen in the last five years, so that may have contributed to the share price decline. On top of that, revenue has declined by 20% per year over the half decade; that could be a red flag for some investors.
You can see how earnings and revenue have changed over time in the image below (click on the chart to see the exact values).

Balance sheet strength is crucial. It might be well worthwhile taking a look at our free report on how its financial position has changed over time.
What About Dividends?
It is important to consider the total shareholder return, as well as the share price return, for any given stock. The TSR incorporates the value of any spin-offs or discounted capital raisings, along with any dividends, based on the assumption that the dividends are reinvested. It's fair to say that the TSR gives a more complete picture for stocks that pay a dividend. In the case of Shenzhen Cheng Chung Design, it has a TSR of 7.7% for the last 5 years. That exceeds its share price return that we previously mentioned. The dividends paid by the company have thusly boosted the total shareholder return.
A Different Perspective
Shenzhen Cheng Chung Design shareholders are up 4.9% for the year (even including dividends). Unfortunately this falls short of the market return. The silver lining is that the gain was actually better than the average annual return of 1.5% per year over five year. This could indicate that the company is winning over new investors, as it pursues its strategy. While it is well worth considering the different impacts that market conditions can have on the share price, there are other factors that are even more important. For example, we've discovered 3 warning signs for Shenzhen Cheng Chung Design (1 is a bit unpleasant!) that you should be aware of before investing here.
For those who like to find winning investments this free list of undervalued companies with recent insider purchasing, could be just the ticket.
Please note, the market returns quoted in this article reflect the market weighted average returns of stocks that currently trade on Chinese exchanges.
New: Manage All Your Stock Portfolios in One Place
We've created the ultimate portfolio companion for stock investors, and it's free.
• Connect an unlimited number of Portfolios and see your total in one currency
• Be alerted to new Warning Signs or Risks via email or mobile
• Track the Fair Value of your stocks
Have feedback on this article? Concerned about the content? Get in touch with us directly. Alternatively, email editorial-team (at) simplywallst.com.
This article by Simply Wall St is general in nature. We provide commentary based on historical data and analyst forecasts only using an unbiased methodology and our articles are not intended to be financial advice. It does not constitute a recommendation to buy or sell any stock, and does not take account of your objectives, or your financial situation. We aim to bring you long-term focused analysis driven by fundamental data. Note that our analysis may not factor in the latest price-sensitive company announcements or qualitative material. Simply Wall St has no position in any stocks mentioned.
About SZSE:002811
Shenzhen Cheng Chung Design
Provides decoration design and engineering, and construction services for hotels, residences, office buildings, clubs, and commercial complexes in China.
Excellent balance sheet second-rate dividend payer.


