Advertisement
- China
- /
- Metals and Mining
- /
- SZSE:002578
Global Penny Stocks To Watch In July 2025

Simply Wall St
Reviewed by Simply Wall St

As global markets navigate a landscape of heated consumer inflation and solid corporate earnings, investors are keenly observing the shifts in major indices like the S&P 500 and Nasdaq Composite, both of which have recently reached new records. Amidst these developments, penny stocks—often linked to smaller or newer companies—remain a compelling area for exploration. Despite being an outdated term, penny stocks continue to offer opportunities for growth at lower price points, especially when backed by strong financials and robust fundamentals.
Top 10 Penny Stocks Globally
| Name | Share Price | Market Cap | Rewards & Risks |
| EZZ Life Science Holdings (ASX:EZZ) | A$2.15 | A$108.97M | ✅ 4 ⚠️ 3 View Analysis > |
| Lever Style (SEHK:1346) | HK$1.41 | HK$883.33M | ✅ 4 ⚠️ 1 View Analysis > |
| Foresight Group Holdings (LSE:FSG) | £4.535 | £508.81M | ✅ 4 ⚠️ 0 View Analysis > |
| Angler Gaming (NGM:ANGL) | SEK3.60 | SEK269.95M | ✅ 4 ⚠️ 2 View Analysis > |
| CNMC Goldmine Holdings (Catalist:5TP) | SGD0.45 | SGD182.38M | ✅ 4 ⚠️ 1 View Analysis > |
| Van Elle Holdings (AIM:VANL) | £0.395 | £42.74M | ✅ 5 ⚠️ 2 View Analysis > |
| Yangzijiang Shipbuilding (Holdings) (SGX:BS6) | SGD2.40 | SGD9.45B | ✅ 5 ⚠️ 0 View Analysis > |
| DXN Holdings Bhd (KLSE:DXN) | MYR0.505 | MYR2.51B | ✅ 5 ⚠️ 0 View Analysis > |
| Begbies Traynor Group (AIM:BEG) | £1.245 | £198.36M | ✅ 4 ⚠️ 2 View Analysis > |
| Netgem (ENXTPA:ALNTG) | €0.976 | €32.91M | ✅ 4 ⚠️ 2 View Analysis > |
Click here to see the full list of 3,818 stocks from our Global Penny Stocks screener.
Let's review some notable picks from our screened stocks.
Sundiro Holding (SZSE:000571)
Simply Wall St Financial Health Rating: ★★★★★☆
Overview: Sundiro Holding Co., Ltd. operates in the coal industry both in China and internationally, with a market cap of CN¥3.96 billion.
Operations: No specific revenue segments have been reported for the company.
Market Cap: CN¥3.96B
Sundiro Holding Co., Ltd. operates with a market cap of CN¥3.96 billion and has shown significant financial challenges, reporting a net loss of CN¥33.4 million for Q1 2025, down from the previous year’s revenue figures. Despite being unprofitable, the company has managed to reduce its debt-to-equity ratio over five years and maintains more cash than total debt, indicating some financial resilience. The management and board are experienced with an average tenure of 4.8 years, providing stability amidst volatility in earnings and operations. Recent corporate actions suggest strategic restructuring efforts to address these challenges.
- Click here to discover the nuances of Sundiro Holding with our detailed analytical financial health report.
- Understand Sundiro Holding's track record by examining our performance history report.

Shandong Mining Machinery Group (SZSE:002526)
Simply Wall St Financial Health Rating: ★★★★★☆
Overview: Shandong Mining Machinery Group Co., Ltd. operates in the manufacturing and distribution of mining machinery and equipment, with a market cap of CN¥6.93 billion.
Operations: Revenue segments for Shandong Mining Machinery Group Co., Ltd. are not reported.
Market Cap: CN¥6.93B
Shandong Mining Machinery Group Co., Ltd. has a market cap of CN¥6.93 billion, with recent financials showing mixed results. The company reported Q1 2025 sales of CN¥434.74 million, up from the previous year, yet annual revenue declined to CN¥2,379.95 million for 2024 from CN¥2,697.57 million in 2023. Despite a stable weekly volatility and sufficient interest coverage due to earnings exceeding interest payments, the company's Return on Equity remains low at 4.6%. Although short-term assets cover liabilities comfortably and debt is well-managed with operating cash flow covering it by 79%, profit margins have slightly decreased alongside negative earnings growth over the past year.
- Click here and access our complete financial health analysis report to understand the dynamics of Shandong Mining Machinery Group.
- Assess Shandong Mining Machinery Group's previous results with our detailed historical performance reports.
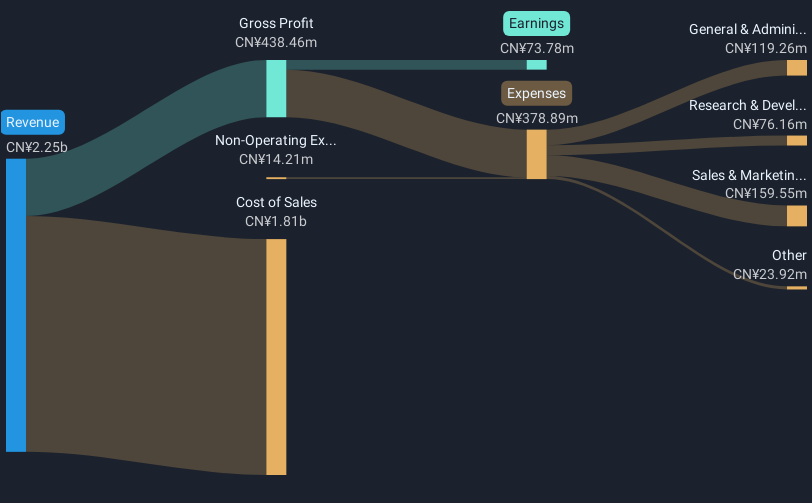
Fujian Minfa Aluminium (SZSE:002578)
Simply Wall St Financial Health Rating: ★★★★☆☆
Overview: Fujian Minfa Aluminium Inc. is a Chinese company that develops, processes, and sells aluminum alloy extruded profiles for architecture, general engineering, and industrial applications with a market cap of CN¥3.20 billion.
Operations: Fujian Minfa Aluminium Inc. has not reported any specific revenue segments.
Market Cap: CN¥3.2B
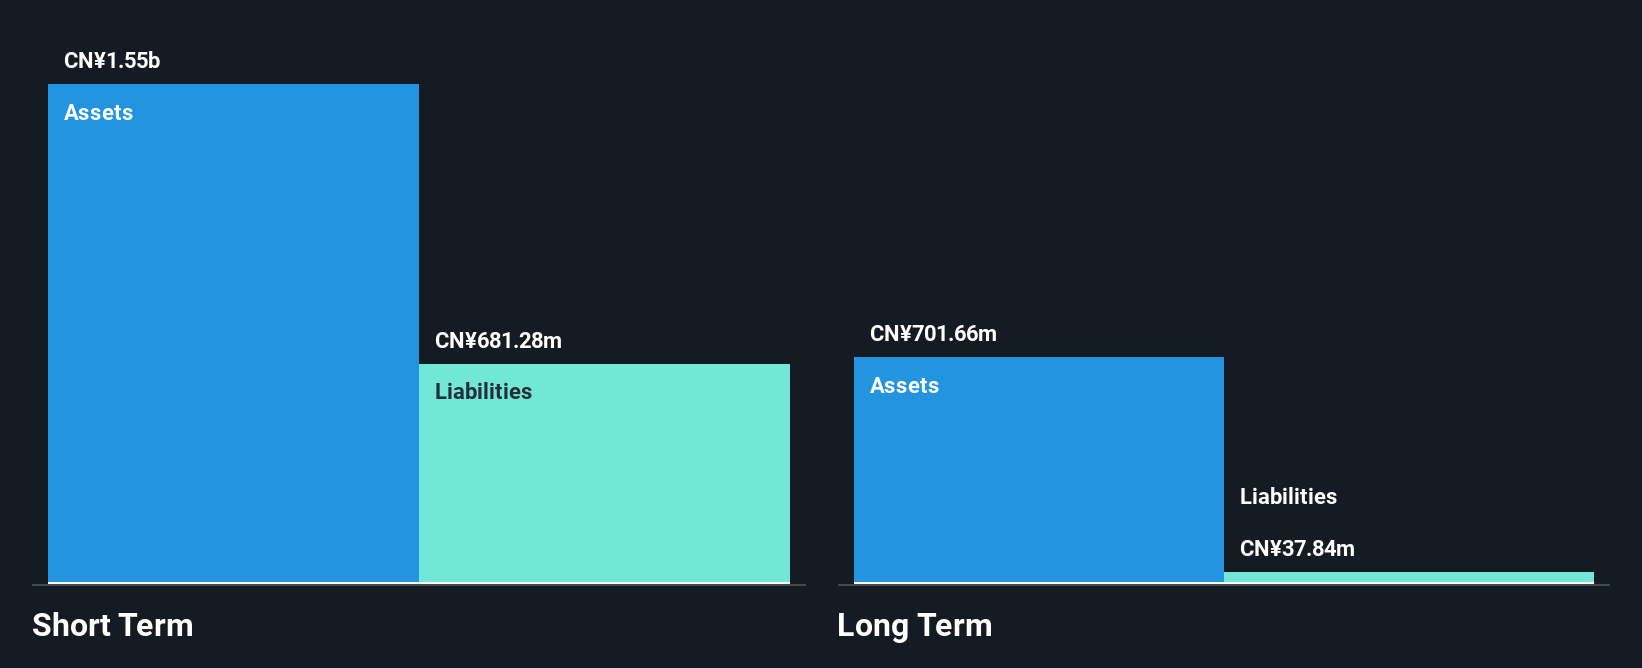
Fujian Minfa Aluminium Inc., with a market cap of CN¥3.20 billion, has experienced a decline in financial performance, reporting first-quarter sales of CN¥299.35 million compared to CN¥408.29 million the previous year. The company's net income also decreased to CN¥2.06 million from CN¥8.76 million a year ago, reflecting lower profit margins of 0.7%. Despite having more cash than total debt and short-term assets exceeding liabilities, its debt-to-equity ratio has increased significantly over five years to 33.6%. Earnings growth remains negative, and Return on Equity is low at 0.9%, indicating challenges in generating shareholder value efficiently.
- Jump into the full analysis health report here for a deeper understanding of Fujian Minfa Aluminium.
- Examine Fujian Minfa Aluminium's past performance report to understand how it has performed in prior years.
Where To Now?
- Take a closer look at our Global Penny Stocks list of 3,818 companies by clicking here.
- Contemplating Other Strategies? Rare earth metals are the new gold rush. Find out which 26 stocks are leading the charge.
This article by Simply Wall St is general in nature. We provide commentary based on historical data and analyst forecasts only using an unbiased methodology and our articles are not intended to be financial advice. It does not constitute a recommendation to buy or sell any stock, and does not take account of your objectives, or your financial situation. We aim to bring you long-term focused analysis driven by fundamental data. Note that our analysis may not factor in the latest price-sensitive company announcements or qualitative material. Simply Wall St has no position in any stocks mentioned.
New: AI Stock Screener & Alerts
Our new AI Stock Screener scans the market every day to uncover opportunities.
• Dividend Powerhouses (3%+ Yield)
• Undervalued Small Caps with Insider Buying
• High growth Tech and AI Companies
Or build your own from over 50 metrics.
Have feedback on this article? Concerned about the content? Get in touch with us directly. Alternatively, email editorial-team@simplywallst.com
About SZSE:002578
Fujian Minfa Aluminium
Develops, processes, and sells aluminum alloy extruded profiles for architecture, general engineering, and industry fields in China.
Adequate balance sheet low.
Market Insights

Advertisement
Community Narratives
MicroStrategy: Volatile Gamble or Golden Opportunity?
Fair Value US$663.00|36.2% undervalued
BL
Community Contributor
Emerging Markets and Debt Reduction Will Propel Bath & Body Works Forward
Fair Value US$40.73|22.0% undervalued
ZW
Community Contributor
An amazing opportunity to potentially get a 100 bagger
Fair Value US$10.00|46.4% overvalued
DA
Community Contributor