Weak Statutory Earnings May Not Tell The Whole Story For SanluxLtd (SZSE:002224)


Sanlux Co.,Ltd's (SZSE:002224) recent weak earnings report didn't cause a big stock movement. However, we believe that investors should be aware of some underlying factors which may be of concern.
See our latest analysis for SanluxLtd
Examining Cashflow Against SanluxLtd's Earnings
As finance nerds would already know, the accrual ratio from cashflow is a key measure for assessing how well a company's free cash flow (FCF) matches its profit. To get the accrual ratio we first subtract FCF from profit for a period, and then divide that number by the average operating assets for the period. You could think of the accrual ratio from cashflow as the 'non-FCF profit ratio'.
That means a negative accrual ratio is a good thing, because it shows that the company is bringing in more free cash flow than its profit would suggest. While it's not a problem to have a positive accrual ratio, indicating a certain level of non-cash profits, a high accrual ratio is arguably a bad thing, because it indicates paper profits are not matched by cash flow. Notably, there is some academic evidence that suggests that a high accrual ratio is a bad sign for near-term profits, generally speaking.
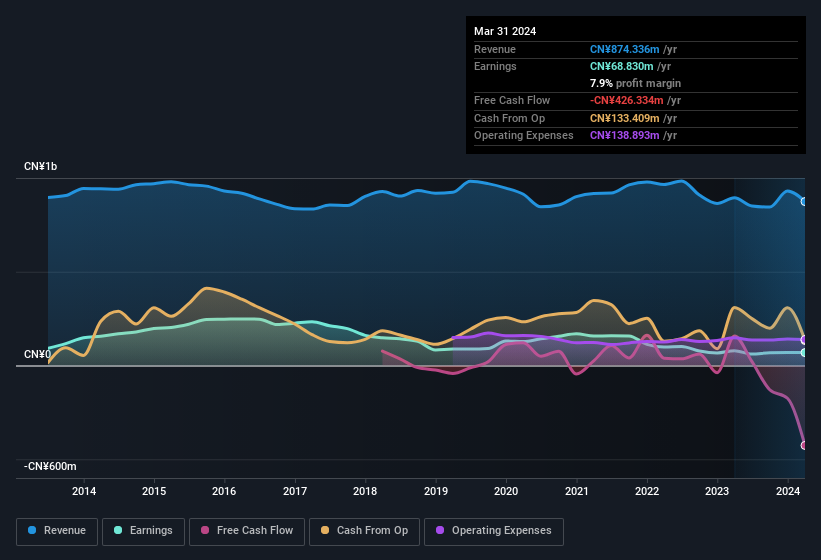
SanluxLtd has an accrual ratio of 0.29 for the year to March 2024. Therefore, we know that it's free cashflow was significantly lower than its statutory profit, raising questions about how useful that profit figure really is. Over the last year it actually had negative free cash flow of CN¥426m, in contrast to the aforementioned profit of CN¥68.8m. We saw that FCF was CN¥157m a year ago though, so SanluxLtd has at least been able to generate positive FCF in the past. Having said that, there is more to consider. We can look at how unusual items in the profit and loss statement impacted its accrual ratio, as well as explore how dilution is impacting shareholders negatively. The good news for shareholders is that SanluxLtd's accrual ratio was much better last year, so this year's poor reading might simply be a case of a short term mismatch between profit and FCF. Shareholders should look for improved cashflow relative to profit in the current year, if that is indeed the case.
Note: we always recommend investors check balance sheet strength. Click here to be taken to our balance sheet analysis of SanluxLtd.
In order to understand the potential for per share returns, it is essential to consider how much a company is diluting shareholders. SanluxLtd expanded the number of shares on issue by 24% over the last year. Therefore, each share now receives a smaller portion of profit. To talk about net income, without noticing earnings per share, is to be distracted by the big numbers while ignoring the smaller numbers that talk to per share value. You can see a chart of SanluxLtd's EPS by clicking here.
How Is Dilution Impacting SanluxLtd's Earnings Per Share (EPS)?
Unfortunately, SanluxLtd's profit is down 56% per year over three years. And even focusing only on the last twelve months, we see profit is down 13%. Sadly, earnings per share fell further, down a full 30% in that time. And so, you can see quite clearly that dilution is having a rather significant impact on shareholders.
In the long term, if SanluxLtd's earnings per share can increase, then the share price should too. However, if its profit increases while its earnings per share stay flat (or even fall) then shareholders might not see much benefit. For that reason, you could say that EPS is more important that net income in the long run, assuming the goal is to assess whether a company's share price might grow.
The Impact Of Unusual Items On Profit
SanluxLtd's profit suffered from unusual items, which reduced profit by CN¥44m in the last twelve months. If this was a non-cash charge, it would have made the accrual ratio better, if cashflow had stayed strong, so it's not great to see in combination with an uninspiring accrual ratio. It's never great to see unusual items costing the company profits, but on the upside, things might improve sooner rather than later. When we analysed the vast majority of listed companies worldwide, we found that significant unusual items are often not repeated. And that's hardly a surprise given these line items are considered unusual. SanluxLtd took a rather significant hit from unusual items in the year to March 2024. As a result, we can surmise that the unusual items made its statutory profit significantly weaker than it would otherwise be.
Our Take On SanluxLtd's Profit Performance
In conclusion, SanluxLtd's accrual ratio suggests that its statutory earnings are not backed by cash flow; but the fact unusual items actually weighed on profit may create upside if those unusual items to not recur. And the dilution means that per-share results are weaker than the bottom line might imply. Based on these factors, we think it's very unlikely that SanluxLtd's statutory profits make it seem much weaker than it is. If you want to do dive deeper into SanluxLtd, you'd also look into what risks it is currently facing. For instance, we've identified 4 warning signs for SanluxLtd (2 are potentially serious) you should be familiar with.
Our examination of SanluxLtd has focussed on certain factors that can make its earnings look better than they are. But there is always more to discover if you are capable of focussing your mind on minutiae. For example, many people consider a high return on equity as an indication of favorable business economics, while others like to 'follow the money' and search out stocks that insiders are buying. While it might take a little research on your behalf, you may find this free collection of companies boasting high return on equity, or this list of stocks that insiders are buying to be useful.
New: Manage All Your Stock Portfolios in One Place
We've created the ultimate portfolio companion for stock investors, and it's free.
• Connect an unlimited number of Portfolios and see your total in one currency
• Be alerted to new Warning Signs or Risks via email or mobile
• Track the Fair Value of your stocks
Have feedback on this article? Concerned about the content? Get in touch with us directly. Alternatively, email editorial-team (at) simplywallst.com.
This article by Simply Wall St is general in nature. We provide commentary based on historical data and analyst forecasts only using an unbiased methodology and our articles are not intended to be financial advice. It does not constitute a recommendation to buy or sell any stock, and does not take account of your objectives, or your financial situation. We aim to bring you long-term focused analysis driven by fundamental data. Note that our analysis may not factor in the latest price-sensitive company announcements or qualitative material. Simply Wall St has no position in any stocks mentioned.
About SZSE:002224
SanluxLtd
Engages in the research and development, production, and sales of rubber V-belts in China and internationally.
Flawless balance sheet slight.
